

JASP lambda selection in Ridge regression renders lambda plots useless

In ridge regression, It seems JASP automatically tries values of lambda that are so large that it renders the variable trace plot and lambda evaluation plot useless. For all datasets I've tried, my variable trace plots look essentially like this:
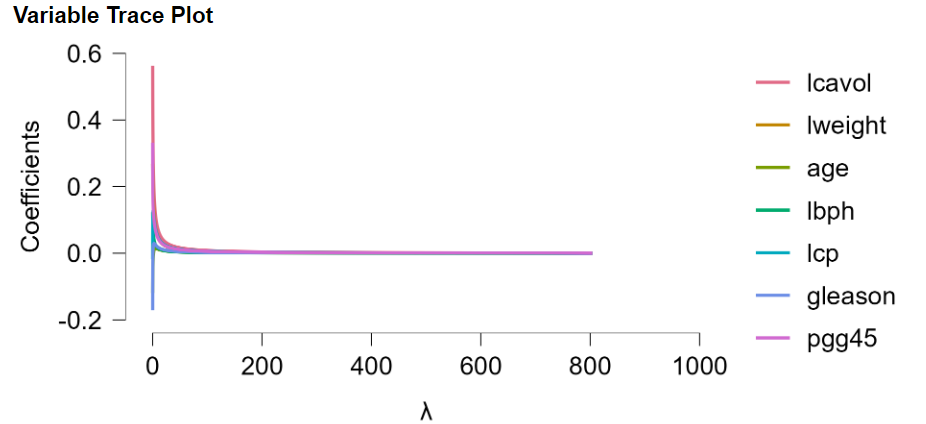
All of the detail of this graph is hidden because the lambda chosen by cross-validation (using either "Optimized" or "Largest lambda within 1 SE of min" is less than 1.
Any way around this?
Comments
You should be able to edit the range of the x-axis in this plot and set it to some value close to 1. See https://jasp-stats.org/wp-content/uploads/2021/09/Graph_Editor-1.gif for a gif on how this can be done.
Thanks @koenderks !