Percentile differences between Jasp & SPSS

Hi all,
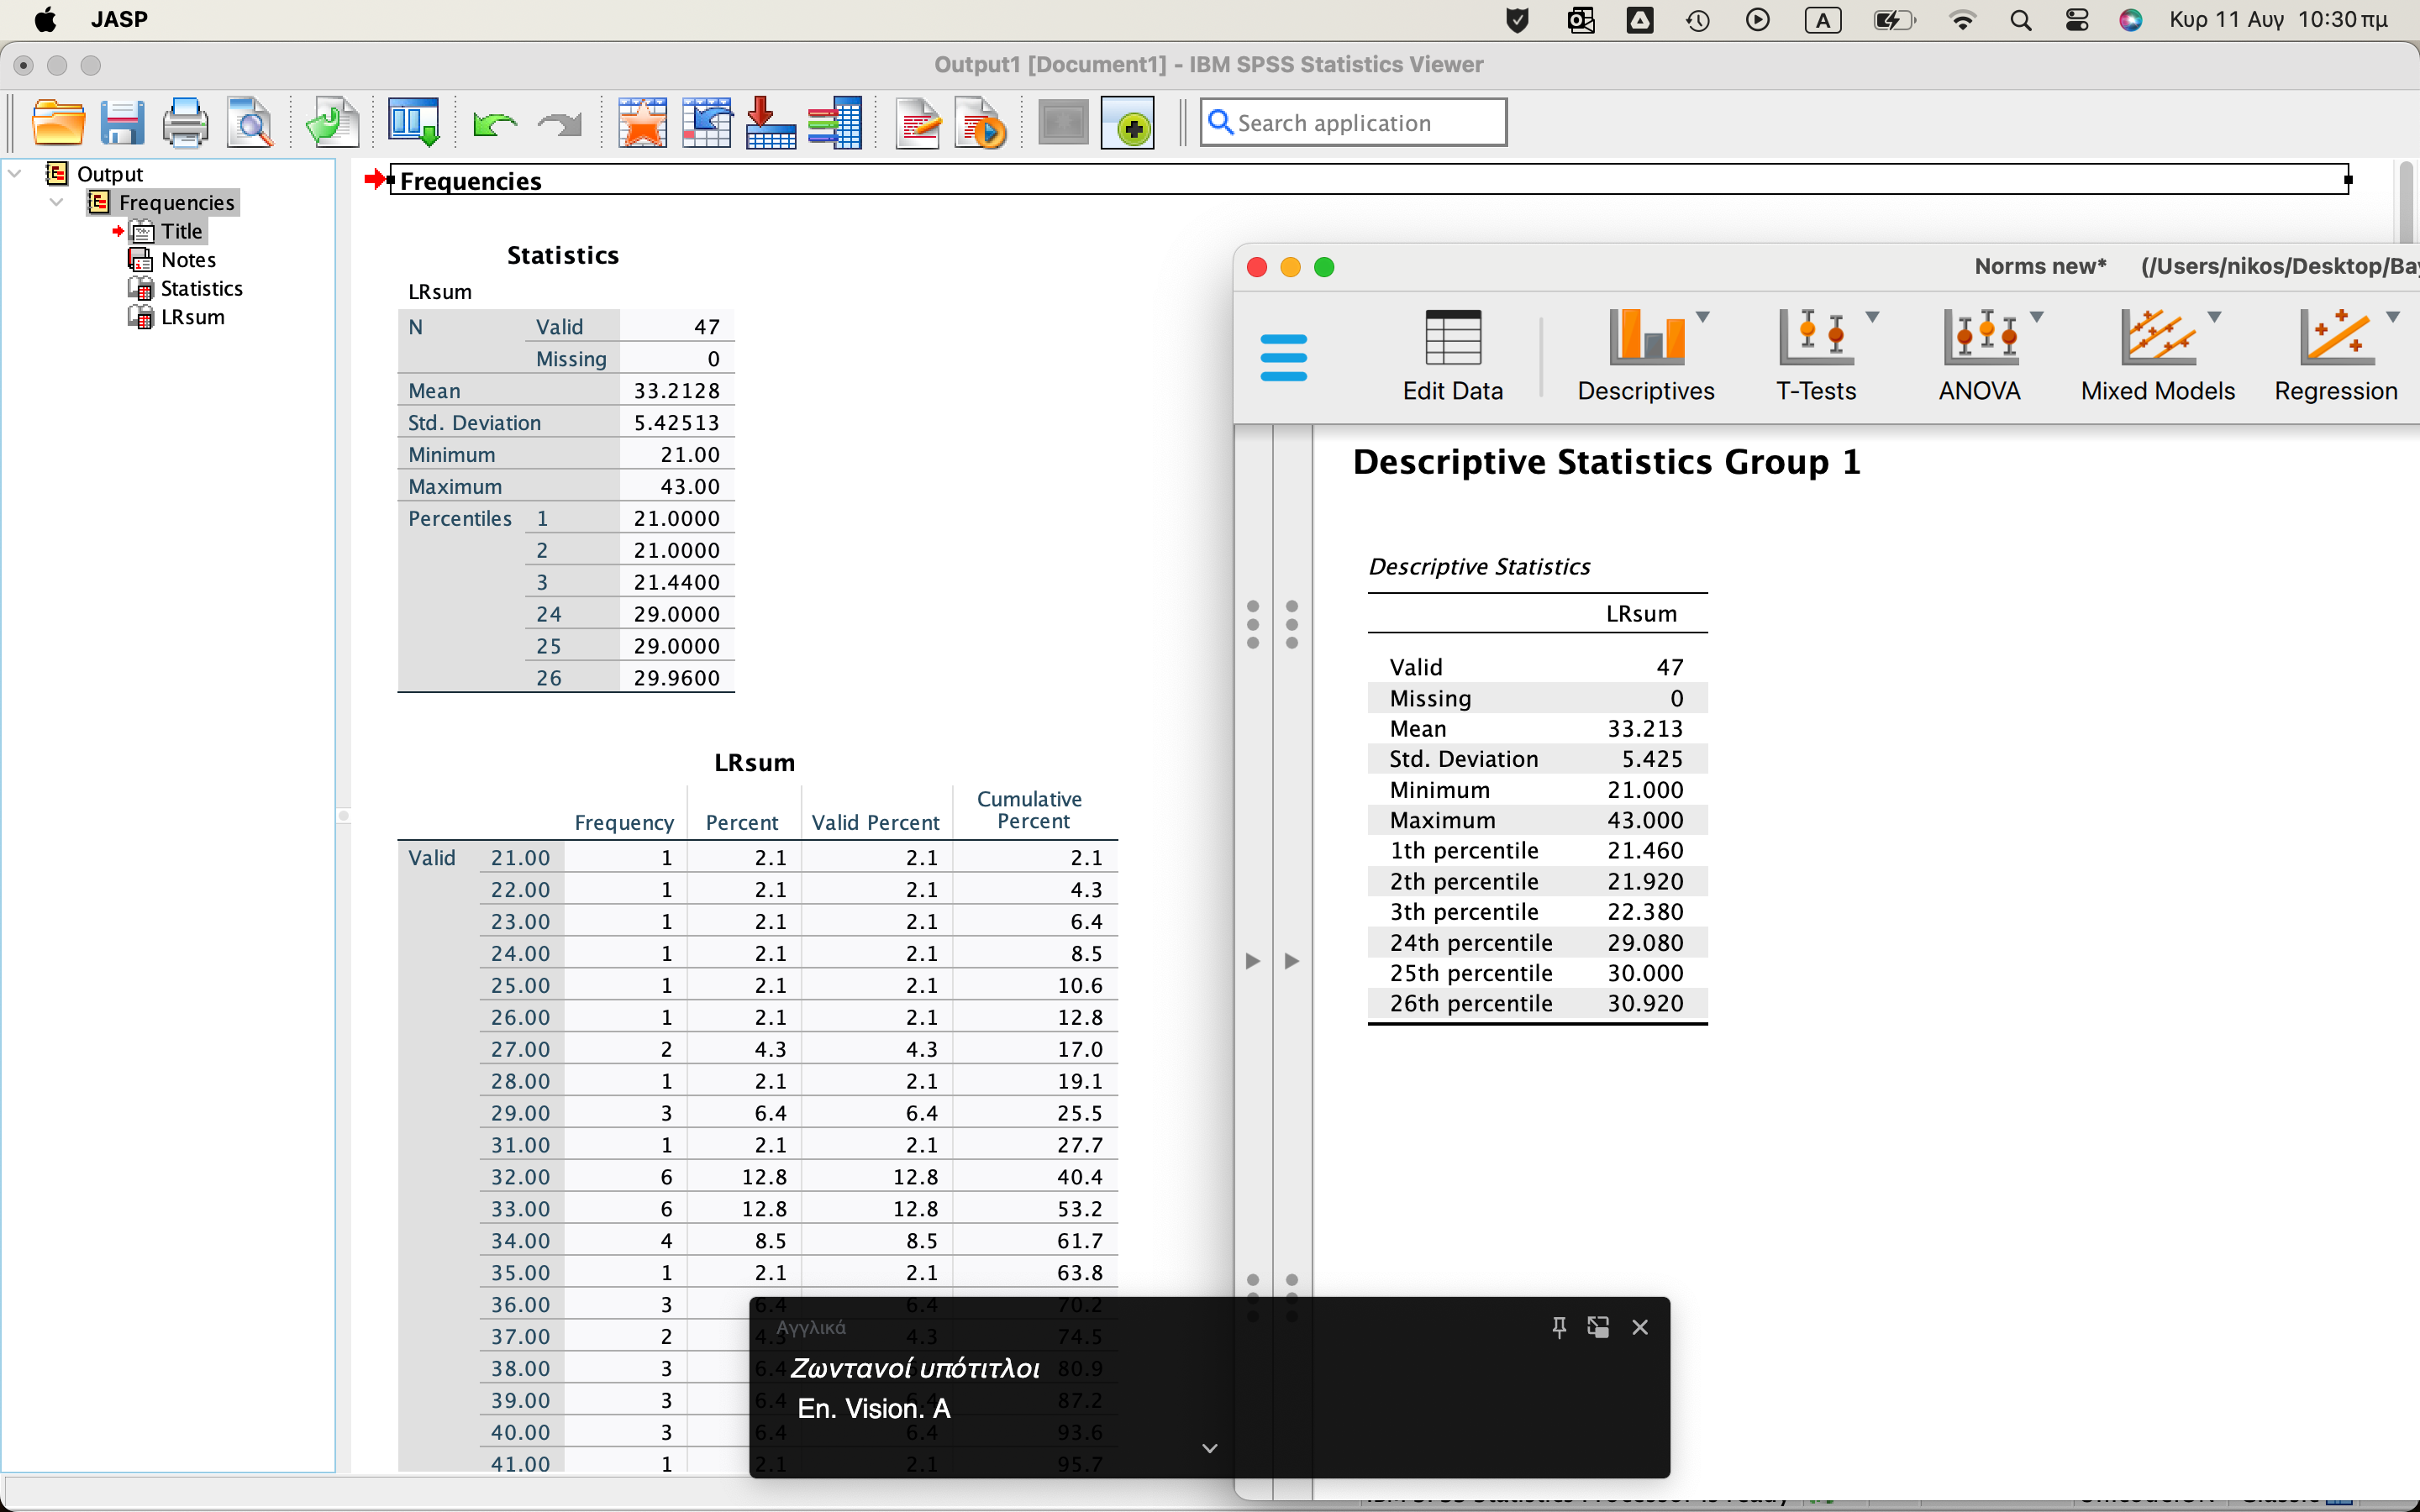
Could someone explain to me why the percentile values of data set differs between Jasp and SPSS?
Thank you in advance,

It looks like you're new here. If you want to get involved, click one of these buttons!

Hi all,
Could someone explain to me why the percentile values of data set differs between Jasp and SPSS?
Thank you in advance,
Comments
There's several methods for calculating percentiles, and the SPSS and R defaults are not the same. (JASP uses R in the background)
https://www.rdocumentation.org/packages/stats/versions/3.6.2/topics/quantile SPSS uses type 6, the default in R is type 7.
Dear patc3,
Thank you for your response. I have gone through the various estimation methods and I am confused as to which one is the best for my situation. I have a developmental test and I have to calculate the 2nd and 25th percentile points for ten different age groups. The data is in the form of integers, the sample size ranges from 35-52 and in each age category there are several replicates of the same values (ties). In R's quantile function, there are 9 different ways of calculating the percentage points. While for the 25th percentile point all methods converge to the same value, there are several discrepancies at the 2nd percentile point. So my question is (if you know) which method is appropriate for this particular dataset.
Thank you in advance,
Nikos
Sorry no I don't know. What I do in that situation is I either use the default, or I use the default of a software that a lot of people use in my field (SPSS).
Ok. Thanks.