

Colours in plots

I have two colour related questions for plots in JASP.
1) Distribution plots
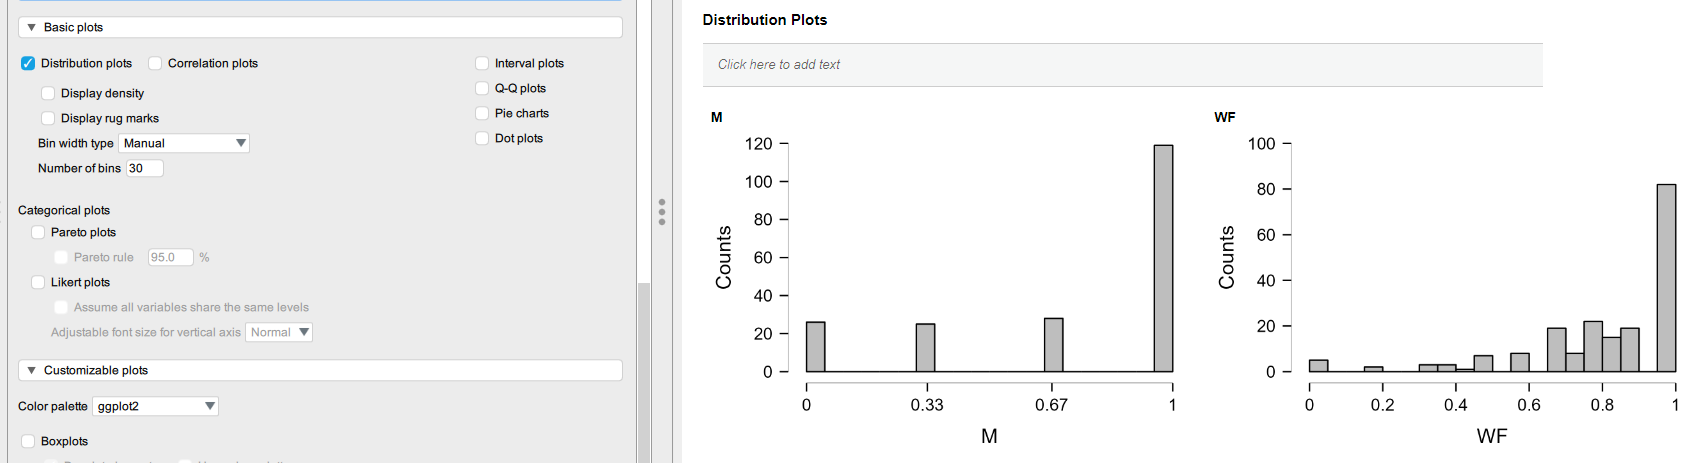
I cannot seem to find any way of adding colour to my distribution plots. It's an option for customizable plots, but not for basic plots it seems?
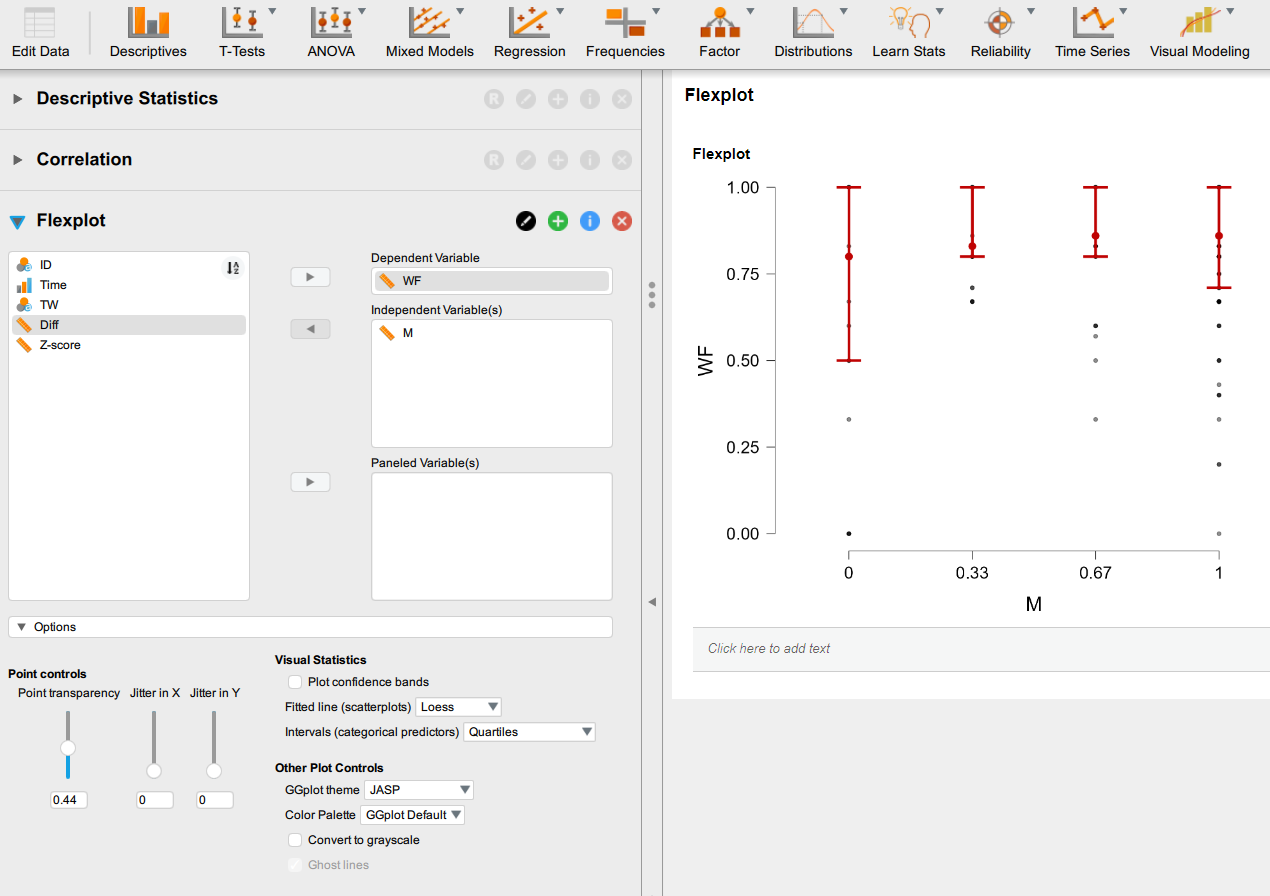
2) Flexplots (from the Visual Modeling module)
Is there any way of changing from red to a different colour in flexplots? I have tried all the different themes and palettes, but they're all red. (I know I can convert to greyscale, but I prefer using colour, just not red.)
Would be really grateful if someone out there knows how to do this. :)
Comments
Other than saving the plots and editing them in different software (e.g., Adobe) I'm not sure. A good feature request for our GitHub page!
EJ
Thanks!
I'm afraid I'm not too familiar with how GitHub works. Where exactly should I stick my request?
For the distribution plots, you’re rightbasic plots in JASP don’t seem to have color options, but you can customize the appearance through the "Customizable plots" option, which is the way to go if you want more control.
As for the Flexplots, if the red is persistent despite trying different themes, you might need to manually adjust the color in the settings (if that option is hidden somewhere in the customization menu). If it’s still not working, a workaround might be exporting the plot and tweaking the colors in a different program, but I know that’s not ideal.
Also, information on out GitHub channel is at https://jasp-stats.org/feature-requests-bug-reports/ and at https://jasp-stats.org/2018/03/29/request-feature-report-bug-jasp/
EJ