

Analysis of simple survey data

Hi,
I am a huge statistics noob and brandnew to JASP.
In the context of an internship I am suppossed to analyze a survey data set.
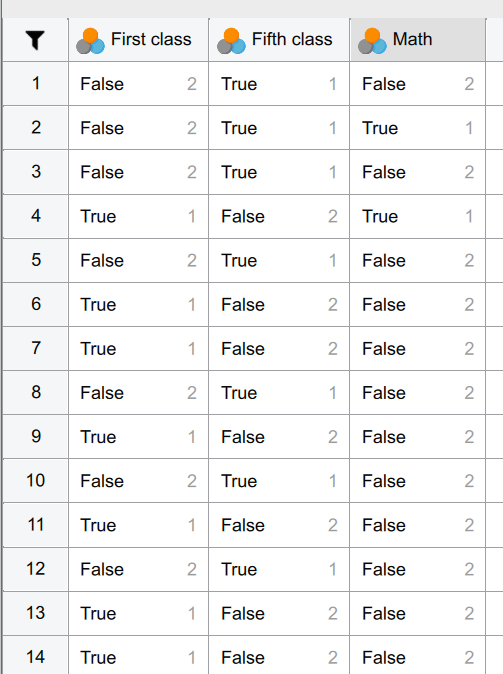
To keep it simple: most of the dataset consists of a variety of different questions that were answered with True (=value 1 in excel) or False (=value 2).
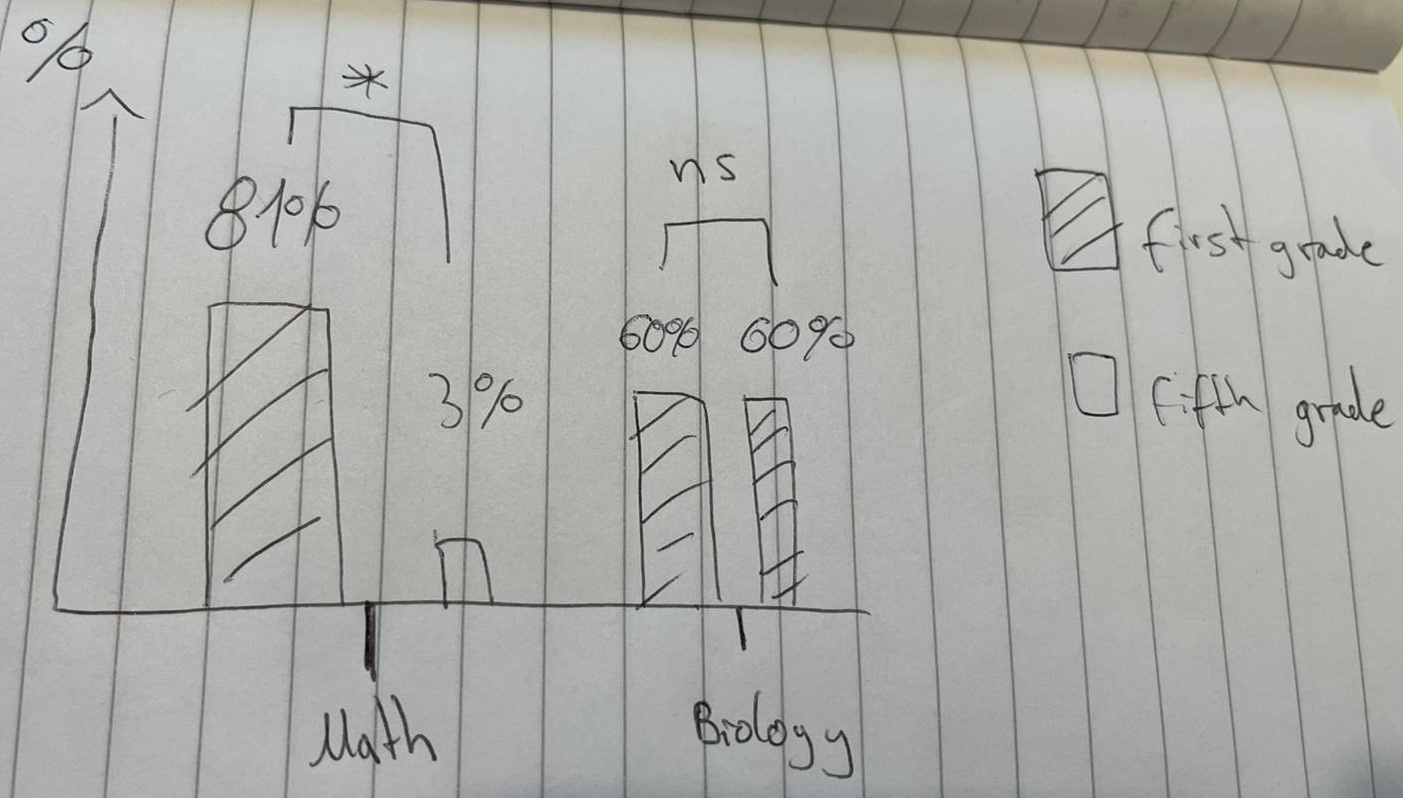
Within this data set there is two subgroups (e.g. First grade or Fifth grade teacher).
I am now suppossed to compare those subgroups with each other in regards to different subjects that they teach. The goal here would be to see if there is statistically significant differences in the percentage of teachers that teach a subject.
Attached find how we envision the final outcome to look like.
Is this doable in JASP, is there maybe already a tutorial or similar post like this ?
Comments
Sounds like a binomial test will do exactly what you need, which you can find under "Frequencies --> Binomial Test" on the ribbon bar along the top of your JASP window. Just drag and drop each variable (e.g. First Class, Fifth Class, Math, etc.) from the box on the left to the box on the right once you're in Binomial Test and that'll do it.