

mt_remap_symmetric

Hi
"My code encountered some difficulties again, and it seems that the problem occurred during the mt_remap_symmetric step. My issue is that the origin is at the top-left corner of the screen, meaning that both the x and y coordinates increase as you move down and to the right, and there are no negative values. After performing the remapping with the default mt_remap_symmetric code, the result looks strange. So, what should I do to mirror the right-side trajectories to the left?"
Any advice would be greatly appreciated.
Below is my code and data structure
library(mousetrap)
library(readbulk)
> raw_data <- read_bulk(directory = "D:/networkanalysis/xsbdata", extension = ".csv")
mt_data <- mt_import_wide(raw_data,
+ xpos_label = "x",
+ ypos_label = "y",
+ zpos_label = NULL,
+ timestamps_label = "t",
+ mt_id_label = NULL,
+ pos_sep = "_",
+ reset_timestamps = TRUE,
+ verbose = TRUE
+ )
No mt_id_label provided. A new trial identifying variable called mt_id was created.
No pos_ids provided. The following variables were found using grep:
1240 variables found for timestamps.
1240 variables found for xpos.
1240 variables found for ypos.
# 定义dimensions,假设你需要对齐 'xpos' 和 'ypos' 维度
> dimensions <- c('xpos', 'ypos')
> # 对齐轨迹数据
> mt_data <- mt_align_start(
+ mt_data,
+ start = NULL, # 使用平均起始点对齐
+ verbose = TRUE
+ )
No start coordinates were provided. Aligning to: 681.921875,709.196354166667
>
> mt_data <- mt_remap_symmetric(
+ mt_data,
+ use = "trajectories",
+ save_as = "trajectories",
+ dimensions = c("xpos", "ypos"),
+ remap_xpos = "left",
+ remap_ypos = "up"
+ )
>
> mt_data <- mt_exclude_initiation(mt_data,
+ use="trajectories", # 使用轨迹数据
+ save_as="trajectories", # 保存修改后的结果
+ dimensions=c("xpos","ypos"), # 指定位置维度,假设是 'xpos' 和 'ypos'
+ timestamps="timestamps", # 时间戳字段名称
+ reset_timestamps=TRUE, # 是否重置时间戳
+ verbose=TRUE # 显示进度信息
+ )
mt_data <- mt_exclude_finish(
+ mt_data,
+ use = "trajectories",
+ save_as = "trajectories",
+ dimensions = c("xpos", "ypos"),
+ timestamps = "timestamps",
+ verbose =TRUE
+ )
mt_data <- mt_length_normalize(
+ mt_data,
+ use = "trajectories", # 原始轨迹数据
+ dimensions = c("xpos", "ypos"),
+ save_as = "ln_trajectories", # 保存归一化的轨迹
+ n_points = 20 # 归一化后的轨迹点数
+ )
>
> mt_data <- mt_time_normalize(
+ mt_data,
+ use = "trajectories",
+ save_as = "tn_trajectories",
+ dimensions = c("xpos", "ypos"),
+ timestamps = "timestamps",
+ nsteps = 101,
+ verbose = FALSE
+ )
>
> mt_data <- mt_measures(
+ mt_data, # 使用整个mt_data对象,包含处理后的轨迹数据
+ use = "ln_trajectories", # 使用长度归一化的轨迹
+ save_as = "measures", # 将计算结果存储到"measures"数据框中
+ dimensions = c("xpos", "ypos"), # 计算x和y位置
+ timestamps = "timestamps", # 使用时间戳列
+ flip_threshold = 0, # 设置 flip 阈值
+ verbose = TRUE # 启用详细输出
+ )
agg_data <- mt_aggregate_per_subject(
+ mt_data, # 你的数据对象
+ use_variables = "xpos_flips", # 计算 AUC 值
+ use2_variables = "exp_type", # 使用 exp_type 进行分组
+ subject_id ="subID" # 不需要按 subID 分组
+ )
>
> t.test(xpos_flips ~ exp_type, data = agg_data)
agg_data <- mt_aggregate_per_subject(
+ mt_data, # 你的数据对象
+ use_variables = "AUC", # 计算 AUC 值
+ use2_variables = "exp_type", # 使用 exp_type 进行分组
+ subject_id ="subID" # 不需要按 subID 分组
+ )
>
> t.test(AUC ~ exp_type, data = agg_data)
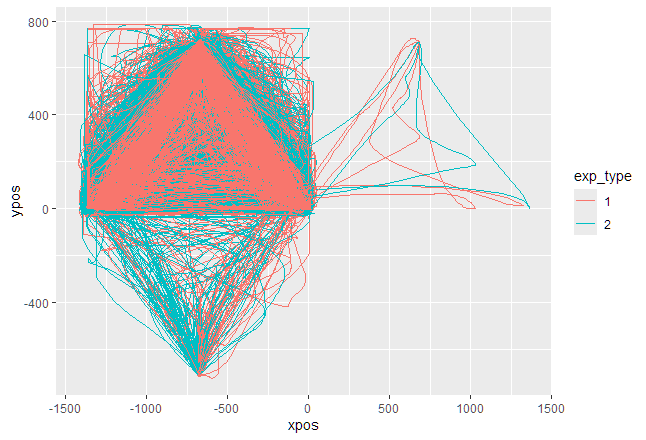
mt_plot(mt_data, use="tn_trajectories", color="exp_type")
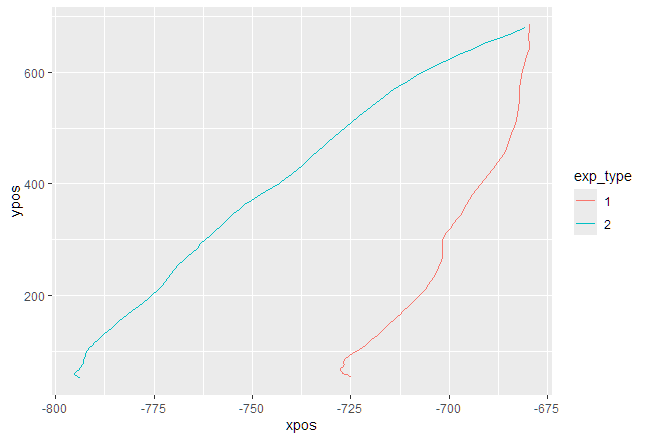
mt_plot_aggregate(mt_data, use="tn_trajectories", color="exp_type", subject_id="subID")
Comments
Hi there,
I think you should provide specific start coordinates for mt_align_start to achieve a more centered coordinate system. Specifically, I would change the mt_align_start code as follows:
mt_data <- mt_align_start(
    mt_data,
     start = c(0, 0),
     verbose = TRUE
)
Afterwards, the remapping of trajectories using mt_remap_symmetric should work.
One comment regarding your first figure: to me it looks like you have three clusters of trajectories: most start in the top left, a few start in the top right, and some start in the bottom left. However, if you use mt_align_start as described above, ideally all trajectories should be mapped so they end up having the same direction.
Best regards,
Pascal