

Meta-analysis of proportions: exceeding 0% and 100% bounds

Hi everyone,
I’ve been using JASP’s meta-analysis module, and it’s been great—really impressive! However, I’ve noticed a small issue when working with meta-analyses of proportions.
The results sometimes go beyond the logical bounds of 0% and 100%. For example, I’ve seen outputs like -5% or values above 100%. While values above 100% could theoretically represent incidence rates, they aren’t really relevant for proportions, which should ideally stay between 0 and 1 (or 0% and 100%). I compared the results with R’s meta package, and the calculations are consistent, but R respects these bounds, making the output more interpretable.
For means, JASP works perfectly because negative values make sense, but for proportions, I was wondering if there’s a way to work around this—maybe an option I missed—to keep the results within the 0 to 1 (or 0% to 100%) range?
Thanks in advance for any help or suggestions!
Comments
Hi Herculano,
Thanks for the nice comments! Regarding your question, there are two things at play:
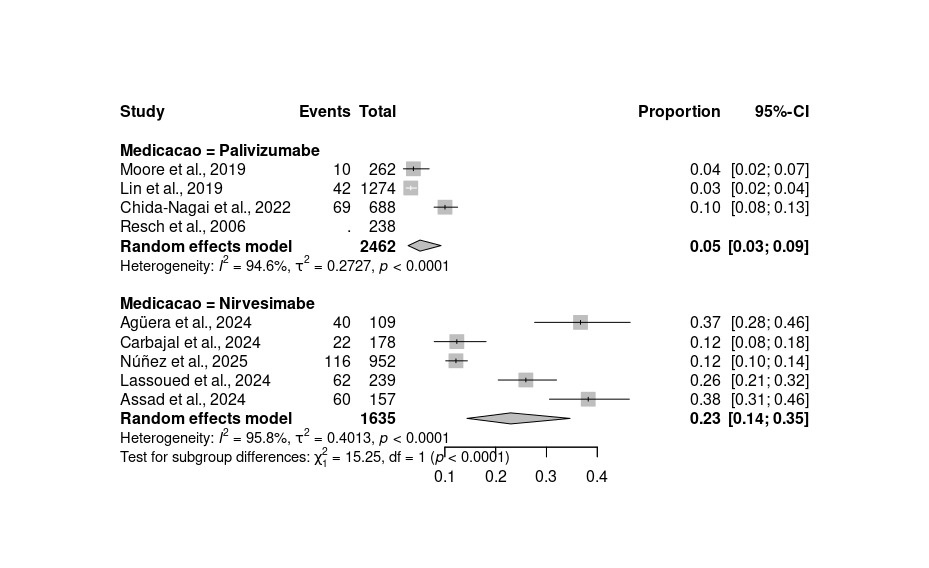
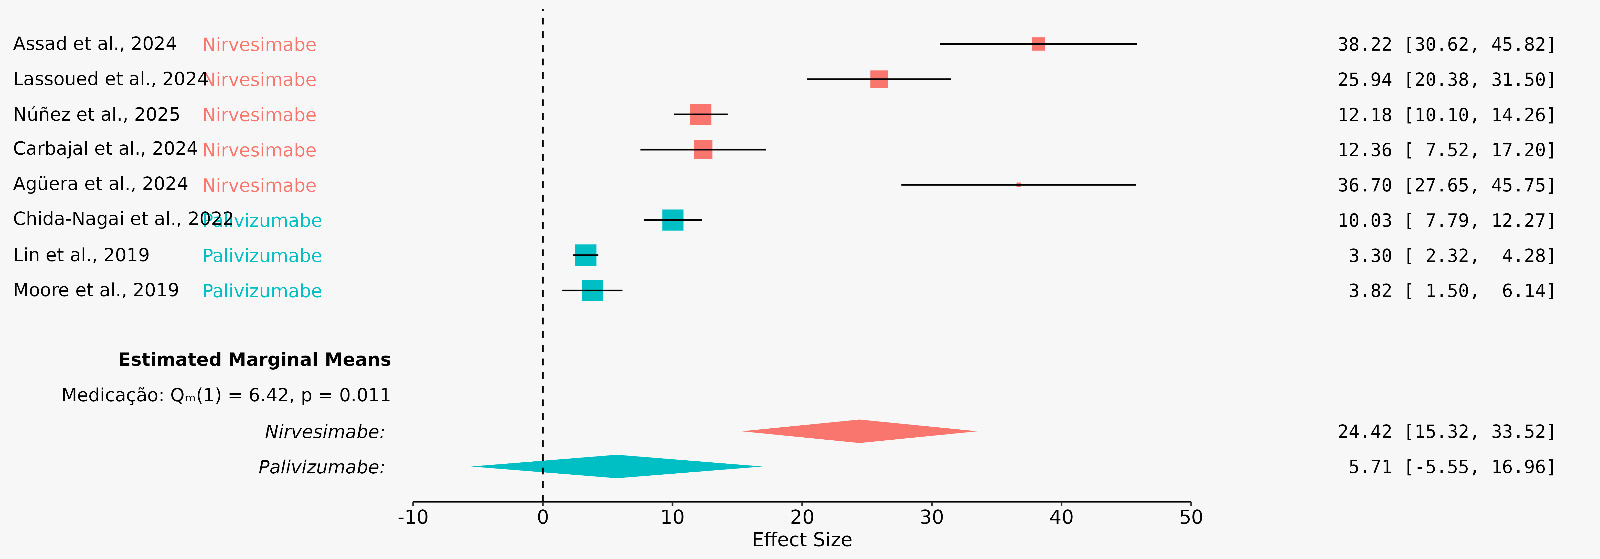
1) The R-output seems to do a subgroup analysis on the data, i.e., fitting an independent random effect meta-analyses to the same data set. Consequently, the heterogeneity estimate is different for each subgroup. The JASP output here does estimated marginal means. i.e., fitting a meta-regression and computing the group-specific effects under the pooled heterogeneity estimates. Both approaches are valid, but you can see that the tau estimate is lower for the first subgroup, which projects itself to narrower CI (which do not intercept 0).
Currently, you can do subgroup analysis in JASP by filtering the data and performing the analyses for each group separately, but we are working on incorporating this functionality in JASP too.
2) If your dependent variable is a ratio (i.e., RR, OR, HR....), it is usually recommended to perform the analysis on the log transformed variable. In fact, metafor and other packages usually output logRR etc when computing effect sizes. The normality assumption of the sampling distribution is met on the log transformation of the variable, and as such it is more appropriate for the analysis. You do however have to do an additional step when interpreting the results - using exponential transformation on the effect size estimate and its confidence intervals.
Cheers,
Frantisek
Hi Frantisek,
Thank you so much for your detailed and helpful response! I really appreciate the explanation about the differences between subgroup analysis and estimated marginal means, as well as the recommendation to use log transformations for ratio variables.
I tried performing the meta-analysis individually (by filtering the data for each group), and as you mentioned, the confidence intervals became narrower. For example, one of the results was 5.66% (95% CI 1.45% - 9.86%), as shown in the image I’ve attached. This approach worked much better for my case, and I can see how the pooled heterogeneity estimate might have influenced the initial results.
I also realized that using logOR is a great solution when dealing with ratio variables, as it allows for negative values and aligns better with the normality assumption of the sampling distribution. This makes a lot of sense, and I’ll definitely keep it in mind for future analyses.
Additionally, I noticed that the small number of studies I used (only 3) might have had a significant impact on the analysis and the calculations. I’ll consider this limitation when interpreting the results.
One thing I found interesting is the idea of using the logit transformation for proportions. When I looked at the R code I used, I saw that applying the logit transformation (log odds) and then converting back to proportions ensures that the results stay within the 0% to 100% range. This approach makes a lot of sense because, even if the log odds are negative, the final transformed proportions are always valid. I’ll explore this further in my analyses.
In cases where the results still exceed these bounds, I plan to manually report them as 0% or 100% in my articles, depending on the context, rather than presenting negative proportions or values above 100%.
Thanks again for your guidance and for clarifying these points. Your help has been invaluable, and I’m really grateful for the effort you put into explaining everything so clearly!
Best regards,
Herculano