Comparing two tests with JASP
Hi there,
I'm a psychology student and this month I attended a statistics course: the professor asked us to create a 15-items test (5 options Likert-type scale for the answers) on Google Form, distribute it and then gather all the answers.
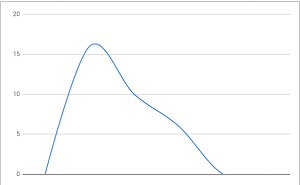
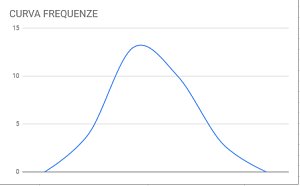
We imported the .xlsx file to Google Sheets and started calculating stuff such as Cronbach's Alpha, variance, means and so on. We eventually generated a graph but only to discover that the resulting data was not normally distributed: we had to replace 4 items (which were causing this data to be skewed) with 4 better items, re-distribute the test and re-generate a new .xlsx. This time the generated graph showed what looks more like a normal curve.
Old test graph:

New test graph:

Now we have to compare the old test with the new one using JASP. I know that we must use a non-parametric test here because we have a skewed set of data in one hand and a normally distributed data in the other hand, but I got kinda lost during the explaination. I'd go with T-Tests -> Paired Samples T-Test -> Wilcoxon Signed-Rank, but I honestly don't know how to correctly organize and insert the data at this point (should it be the right one) on JASP.
Bonus question: is there a way to know/calculate if a given curve (which looks kinda normal, like the newer one I got) can be considered normal or not?
Thanks in advance! I really appreciate your help.
Dario


Comments
Hi Dario,
Well, first off, data from a Likert scale can never be normal, because the scale is discrete. But sum scores across several items (or average scores across participants, or averaged sum scores across participants) can be approximately normally distributed. There are formal tests but most often people just do a QQ plot.
Secondly, I am not sure a significance test is what you need. You were unhappy with some items, did some more work, and arrived at a test you believe to be better. Why is it of interest whether the difference is statistically significant?
Thirdly, I am not 100% sure what aspect of the distribution you would like to compare. The entire distribution? [I think a QQ plot or a KS test are tools for that] Your search for a t-test indicates you would only like to compare the means -- but why exactly is this? Also, you probably distributed the test to new participants, in case you have an unpaired t-test, not a paired t-test...
Cheers,
E.J.
Hi E.J., thanks for your reply.
Obviously my lack of knowledge of statistics (and english not being my native language) hasn't helped me to be clear. I apologize for this.
When we were working on the first version of the test we calculated the Pearson correlation coefficient between each item and the whole test (using the =CORREL function between all the scores of a single item and all the total scores of the participants, this done with every item): in this way we recognized the items that needed to be replaced by looking at their low r value (most of the items were over r=0,70, so we replaced 4 items under r=0,30)
Items got replaced, test got re-distributed, all the new item/test correlations were over r=0,70.
Now the professor just encouraged us to calculate how much the old version of the test is correlated to the new one, suggesting that a non-parametric test done with JASP could be the best choice (since we have not normally distributed data).
Even understanding which JASP function is needed in this case, I wouldn't know how to correctly organize the .csv file to import.
I understand this request can sound kinda vague (I got lost, as a matter of fact), but I was also hoping to learn something more about statistics by understanding how such things can be done with JASP.
Thanks in advance again!
Dario
Hi Dario,
"calculate how much the old version of the test is correlated to the new one"
Since the old and new test share a lot of items, the correlation has to be high. To compute the correlation, ideally you have the same people answer all the items. But what exactly do you want to correlate? The sum score across all the items?
Cheers,
E.J.
Yes, I assume that calculating the correlation between the sum score across all the items of both tests could be a good point, like pairing the scores of the items that both tests have in common but also counting the "effect" of the items that have been removed and replaced. Thanks!
Dario