

Sample entropy analysis

Hello,
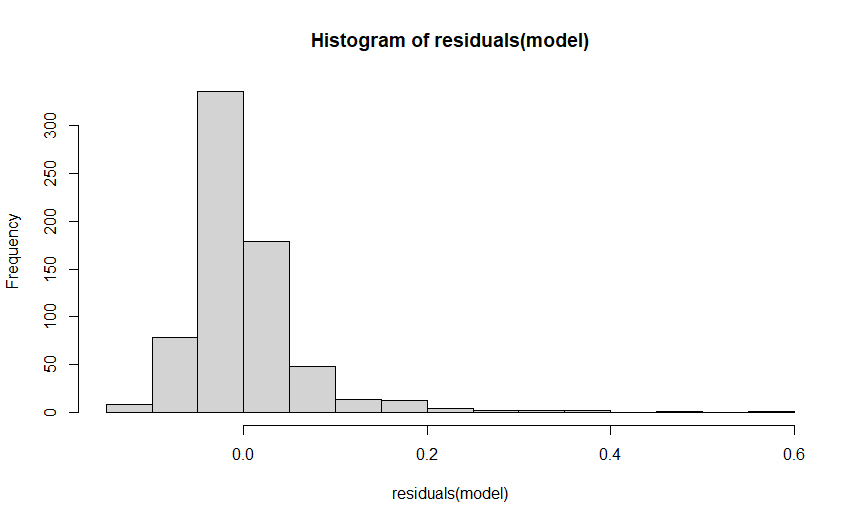
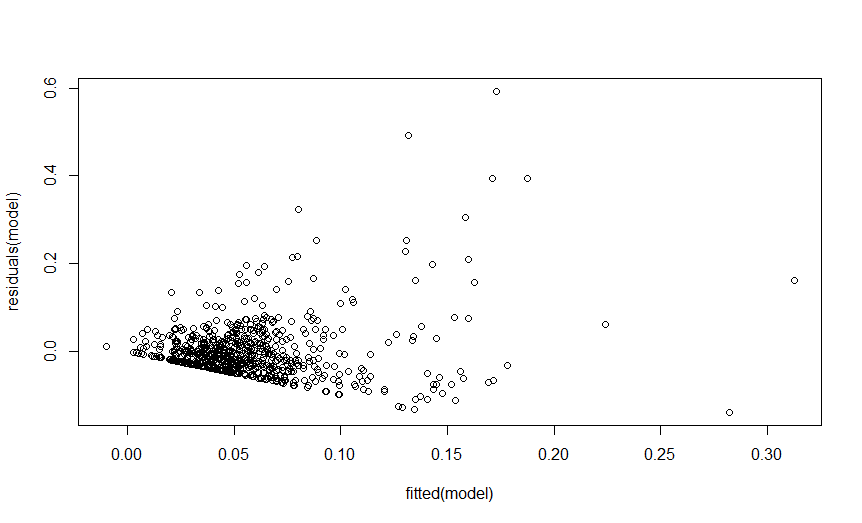
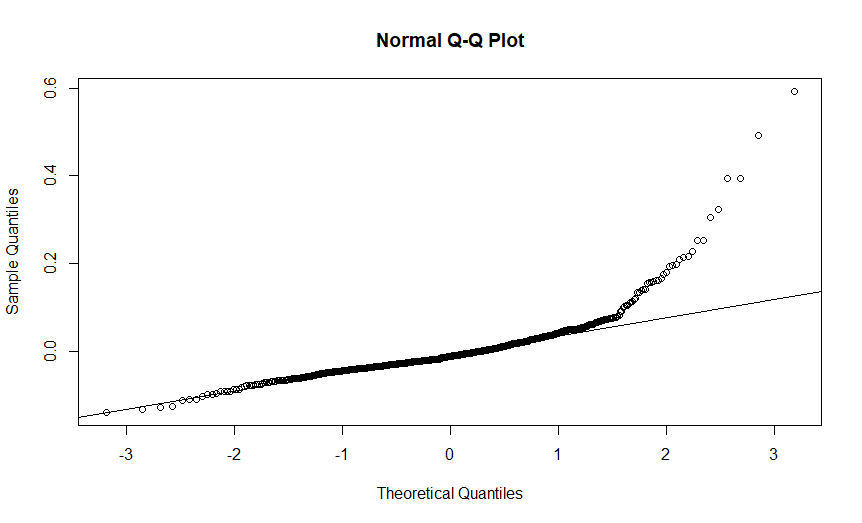
I am analysing sample entropy of my mouse-tracking data using lmer. As seen by the residuals of my model, the distribution does not seem to be normal. I tried to log-transform sample entropy but given that I have a lot of zero values, the log-transformation produces 'infinite' values and as a result I get an error when I try to make a model with a log-transformed sample entropy.
Do you know how sample entropy is usually analysed, e.g. is it advisable to transform it or not, or should I use a different function/family?
Any advice would be much appreciated.
Thank you in advance,
Sofia
Comments
Hi Sofia,
that's a good question. Unfortunately, I also don't have a perfect answer here. One possible alternative to log transformation could be a square-root transformation as this can handle 0s.
However, values of exactly 0 for sample entropy should actually be unlikely to occur in practice (close to 0 might be possible, but exactly 0 could be an indicator that a trial has maybe only very few recorded positions, e.g., just start and end), so it might be worth inspecting those cases.
Best,
Pascal
Dear Pascal,
Thank you for your answer.
Actually, there are a lot of zero values of sample entropy and the mean is also very close to 0 (~0,06, maximum value: ~0.8), even though we have only kept trials that have more than 2 logged positions, and have also removed trials where the startpoint of the (time-normalised) trajectory appeared equal to the endpoint. Do you have any idea why that might be?
Best,
Sofia
Dear Sofia,
hmm I am not sure. Have you plotted the trajectories with sample entropy values of 0 to check?
Best,
Pascal
Dear Pascal,
Thanks a lot for your suggestions.
I transformed sample entropy with square root transformation and this seems to normalise the distribution a bit and improve the residuals (see residual plot of model with transformed entropy below).
As for the zero values of entropy, I plotted the trajectories for those specific trials as you suggested and they are indeed very small in size, which I guess results in the zero values (compare overall trajectories and trajectories with entropy=0 in plots below). However, I would be hesitant to delete them as they are still informative. Also, as I mentioned before, the positive values of entropy are still very small and close to zero. We suspect it could be due to the small size of the time interval we are investigating (time normalised to 101 steps). Note that we don't look at the whole mouse trajectory (starting from 0,0) but part of it, that's why trajectories appear to start further up.
Would you possibly have time to take a look at our design? It is more complicated than previous mousetracking studies (e.g. Freeman & Ambady 2010) and so we might miss something still..
Thanks again for your time!
Sofia
Dear Sofia,
please excuse the delayed reply. As I have left academia some time ago (transitioning into an industry position), it usually takes me some time to answer questions in the forum as I can only check it in my free time. (I still continue to maintain the open source packages I developed, e.g., mousetrap, and I am also happy to provide support through this forum.)
I think that based on what you wrote and what can be seen in the plots it is quite plausible that you have sample entropy values close to zero as you are only looking at very short and, more importantly, mostly straight trajectory with little fluctuation. The only solution I could imagine is to look at a greater parts of the trajectories (if I understood you correctly you only look at trajectory parts in your analysis).
Best,
Pascal