

Trajectory alignment issues

Dear Pascal and everyone,
My apologies for the lengthy post, I tried to be as specific as possible in my problem description and to include all relevant code, warnings and output.
I am having problems aligning trajectories to common start- and end-points. I have collected data with E-Prime GO and imported them with mt_import_long(). My design requires participants to start from the bottom center of the screen and choose one of both responses at the top corners of the screen. Responses need to be given in order to proceed, and there are no missing points in my raw dataset (24 items x 85 participants). Location of correct responses is counterbalanced, so half of the trajectories end in the top left, half in the top right corner.
mtdata <- mt_import_long(mt_prepdata, xpos_label = "xpos", ypos_label = "ypos", mt_id_label = c("Subject", "Sample"), mt_seq_label = "timestep", reset_timestamps = T)
No timestamps were found in the data. Artificial timestamps variable created assuming equidistant time steps.
This assumption should be warranted, because my sampling rate was constant at 25ms.
[Sidebar: while preparing the dataset before import, I ended up with columns of coordinates over time: xpos, ypos, t. To my confusion, "t" is logged as "absolute" time in ms, rather than relative to trial onset, i.e., it is calculated from the beginning of the experiment in successive 25ms-steps. As a consequence, rather than having "t"-sequences from 0ms, they start from the ms in which participants gave the first mouse-tracking response during the experiment, after other cognitive assessments, so e.g., 4598349867 ms or something ridiculous like that).
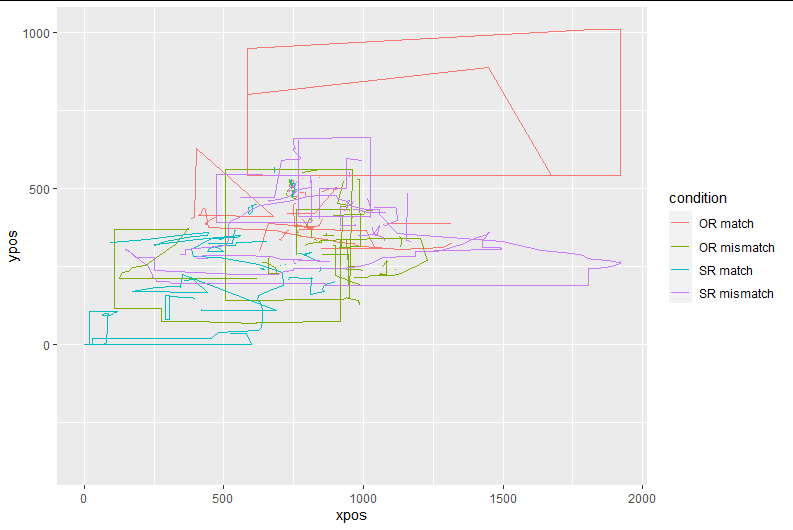
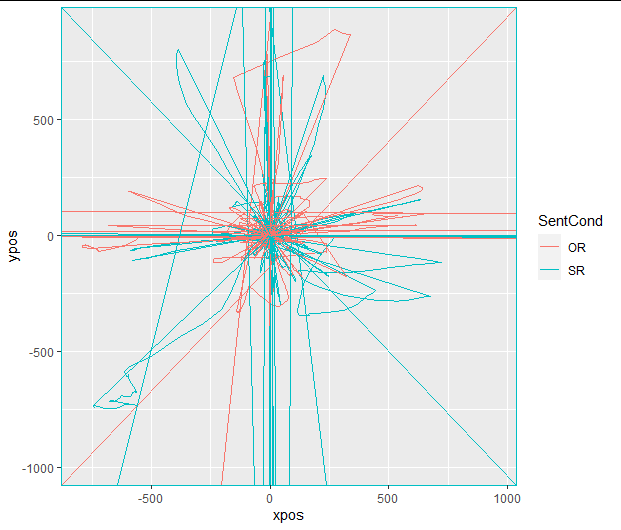
I believe it is for this reason that the data looked weird when plotting them right after import:
mt_plot_aggregate(mtdata, use="trajectories", x="xpos", y="ypos", color="condition", subject_id="Subject")
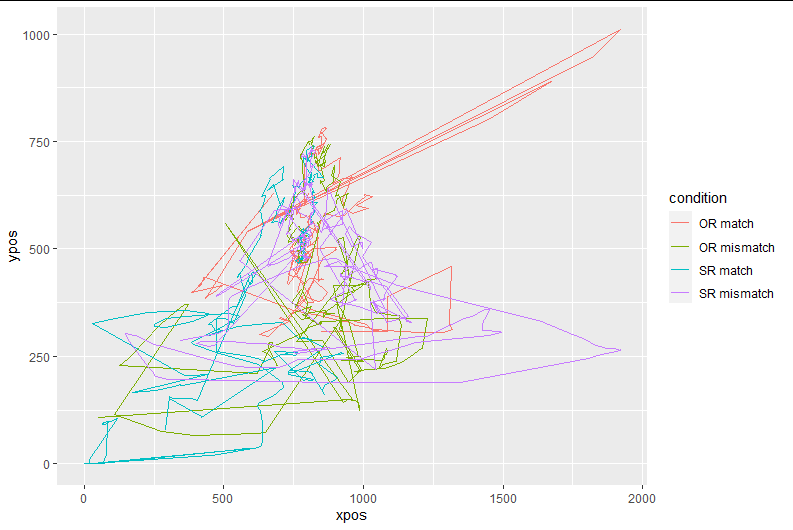
To avoid this, I deleted the "t" column from the data to be imported with mousetrap. To replace the "t" variable, I created a "timestep" column (before mt_import_long) by creating a number sequence for each x-y-coordinate pair which restarts every time SubjectID and/or the ItemID change. However, the "timestep" variable created by me does not seem to be recognized when I specify it as the "timestamps" variable at import (hence the warning message about equidistant timestamps being created automatically). After these steps, I get plots that look more sensible right after import, as compared to importing with the "t" variable.
mt_plot_aggregate(mtdata, use="trajectories", x="xpos", y="ypos", color="condition", subject_id="Subject")
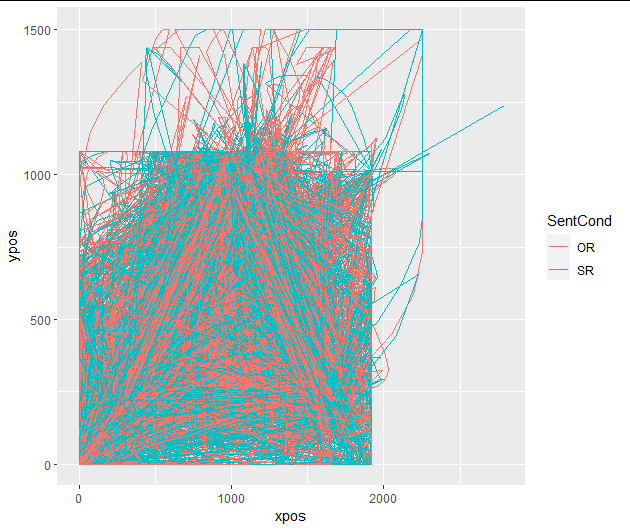
mt_plot(mtdata, use = "trajectories", use2 = "data", x = "xpos", y = "ypos", color = "SentCond", alpha = NA, size = .1, mt_id = "mt_id", subject_id = "Subject")
[End of sidebar]
Clearly, however, the data needed some more cleaning. To eliminate trials that started and ended in the same position, I used the following code (from another thread in this forum):
mtdata$data$pos_var <- apply(mtdata$trajectories[,,"xpos"],1,var,na.rm=TRUE) + apply(mtdata$trajectories[,,"ypos"],1,var,na.rm=TRUE)
table(mtdata$data$pos_var==0)
FALSE TRUE
2010 30
mtdata <- mt_subset(mtdata,mtdata$data$pos_var>0)
nrow(mtdata$data)
[1] 2010
After this step, the plotted data look exactly like the image above (unsurprisingly).
I eliminated all trajectories from incorrectly answered trials:
mtdata <- mt_subset(mtdata, mtdata$data$accuracy==1)
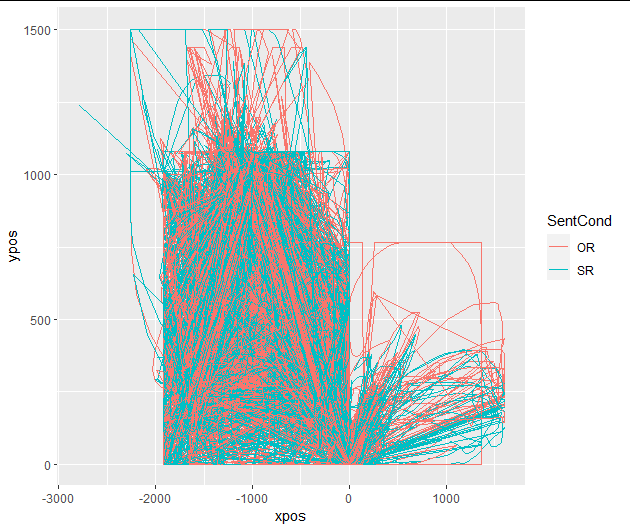
I then use mt_remap_symmetric() (without any further arg specification). Now the same plot looks like this:
At this point, I use the code:
mtdata <- mt_align_start_end(mtdata, use = "trajectories", save_as = "aligned_trajectories", verbose = FALSE)
and get the warning:
Warning messages:
1: In mt_align_start_end(mtdata, use = "trajectories", save_as = "aligned_trajectories", :
NaN/Inf/-Inf values returned in some trials for the dimension xpos as their start and end coordinate was identical.
2: In mt_align_start_end(mtdata, use = "trajectories", save_as = "aligned_trajectories", :
NaN/Inf/-Inf values returned in some trials for the dimension ypos as their start and end coordinate was identical.
Now, generating the plot as above gives me the following warning:
Warning message:
Removed 22191 row(s) containing missing values (geom_path).
The new plot (i.e., of "aligned" trajectories) looks like this:
Clearly, this does not seem to be the right approach.
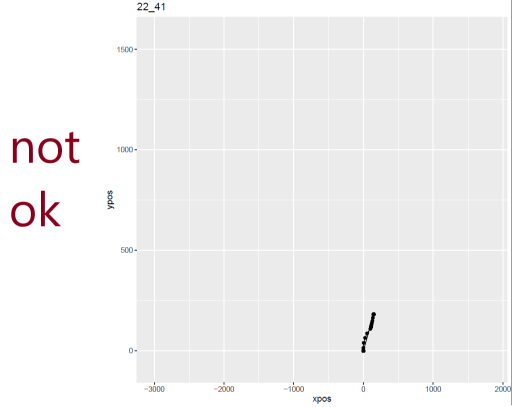
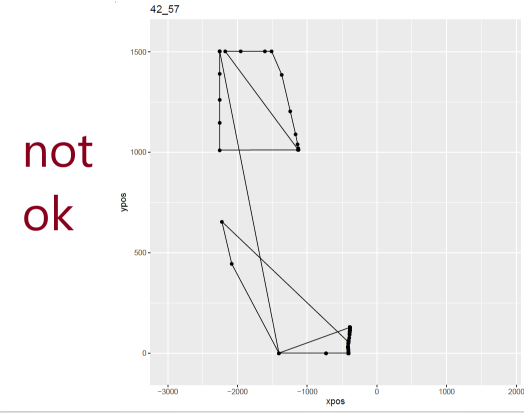
I set out to eliminate weird-looking trajectories manually with mt_plot_per_trajectory() before attempting to re-align trajectories. I identified over 20 participants whose coordinates look like there have been technical issues. Within the remaining participants, I had to proceed to further remove quite a few trials which were displaying the same issues. My sample size went from n = 85 to n = 59 in this step. Here an example of one good-looking and two not-good-looking trajectories:

After this step, I tried to use mt_align_start_end() again, and got the same warnings:
Warning messages:
1: In mt_align_start_end(mtdata, use = "trajectories", save_as = "aligned_trajectories", :
NaN/Inf/-Inf values returned in some trials for the dimension xpos as their start and end coordinate was identical.
2: In mt_align_start_end(mtdata, use = "trajectories", save_as = "aligned_trajectories", :
NaN/Inf/-Inf values returned in some trials for the dimension ypos as their start and end coordinate was identical.
Plotting the data gives the same error message (but with fewer "removed rows containing missing values" than before excluding "faulty" trajectories).
I then had to switch to mt_align():
mtdata<- mt_align(mtdata,use = "trajectories",save_as = "aligned_trajectories",verbose = FALSE)
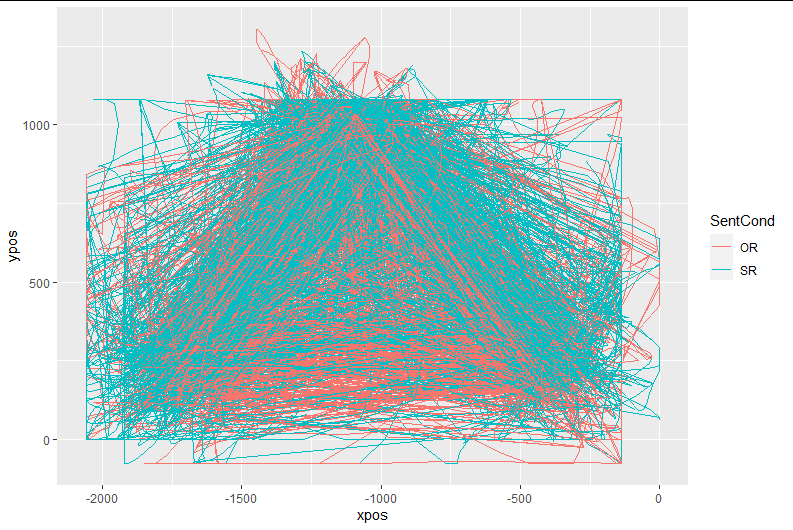
No warnings, and the plot now looks like this:
Then I time-normalized the aligned trajectories (now saved simply as "trajectories", because the "timestamps" variable was absent from the renamed "aligned_trajectories" array):
mtdata <- mt_time_normalize(mtdata, use= "trajectories", save_as = "tn_trajectories")
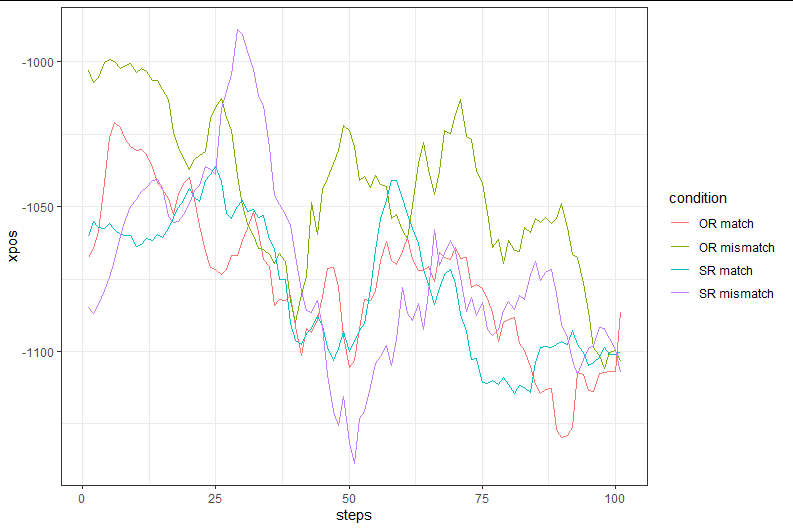
Now, I would expect time-normalized trajectories to be aligned. However, when I go ahead and plot the data, it looks like the starting points differ substantially between conditions, such that I am led to think that one or more of the previous steps were either wrong or implemented incorrectly.
mt_plot_aggregate(mtdata, use="tn_trajectories",
x="xpos", y="steps", color="condition",
subject_id="Subject")+
ggplot2::theme_bw()+ ggplot2::coord_flip()
My questions:
- Could the alignment issues be originating from data preparation steps before importing with mousetrap?
- Are the pre-processing steps (with the mousetrap package) sufficient for analysis, or have I missed anything important? E.g., I am not sure whether the
mt_align()function is also flipping trajectories in such a way that they all end on the same side. - Do you have any suggestions to "rescue" at least a bit of all the data lost from the exclusion of "faulty" trajectories? Perhaps there are some transformations I could be implementing to solve or avoid similar issues (and if it is a problem with data collection, perhaps I could be avoiding the same mistakes in the future).
- If all of the above seem fine, any suggestions for how to align the starting positions on the graph?
My next step in the analysis is to run mixed-effects linear regression with xpos as continuous outcome variable. Thank you for reading until here, any help would be greatly appreciated!
Best,
Carlotta
Comments
P.S.: I don't think the problem is with the graph, here a histogram of starting x-positions in my time-normalized array: only 40% of the trajectories are starting at -960, where I would expect them to. And apparently, this differs between my conditions...
Hi Carlotta,
before answering your questions you raise at the end I try to comment on some of the points in your data preparation before first, as they might resolve some of the later issues. Maybe you could try them out first and then bring up remaining questions / issues afterwards.
Regarding timestamps: you can use the absolute timestamps (i.e., timestamps counting upwards since the start of the experiment or some other fixed point in time) by specifying the corresponding column via the timestamps_label argument in mt_import_long. Actualy, mt_import_long by default assumes that you have absolute timestamps and resets them per trial (see documentation of the reset_timestamps argument: http://pascalkieslich.github.io/mousetrap/reference/mt_import_long.html)
Regarding the first mt_plot_aggregate figure: I think this figure looks weird because you are plotting non-time-normalized data (and potentially also because trajectories are not aligned). mt_plot_aggretate usually only makes sense if you plot trajectories that all are represented by the same number of coordinates and that have been remapped so they end on the same side of the screen (at least within conditions).
Regarding screening for trials with equal start and end position: I don't understand how this can be the case, if the points you write above hold: "My design requires participants to start from the bottom center of the screen and choose one of both responses at the top corners of the screen. Responses need to be given in order to proceed, and there are no missing points in my raw dataset". Do you maybe have a timeout until when participants need to give a response? If so, does it make sense to exclude trials where participants do not give a response? Or, it could be, as you write above that there have been technical issues in the some trials. If so, the screening of the individual trajectory plots you mention above is a good idea (and subsequent exclusion of trajectories with technical issues).
Regarding aligning and remapping: mt_remap_symmetric assumes a centered coordinate system (see documentation http://pascalkieslich.github.io/mousetrap/reference/mt_remap_symmetric.html). I am not sure whether this is the case in EPrime. However, one potential solution could be to first call mt_align_start (not start_end) to align the start points of the trajectories (in case this makes sense for your design) and then use mt_remap_symmetric.
The warnings mt_align_start_end are caused by trials in which your trajectories have an identical x value at start and end or an identical y value at start and end. Again, I am unsure if this is plausible in your design if what you write above holds (i.e., participants have to start in the bottom center and then end in one of two corners in the screen)? However, mt_align_start_end is not that often used in any case, so I guess that aligning the start position only and then remapping to one side should be fine.
Best,
Pascal