

How confidence intervals are calculated for paired samples t-test?

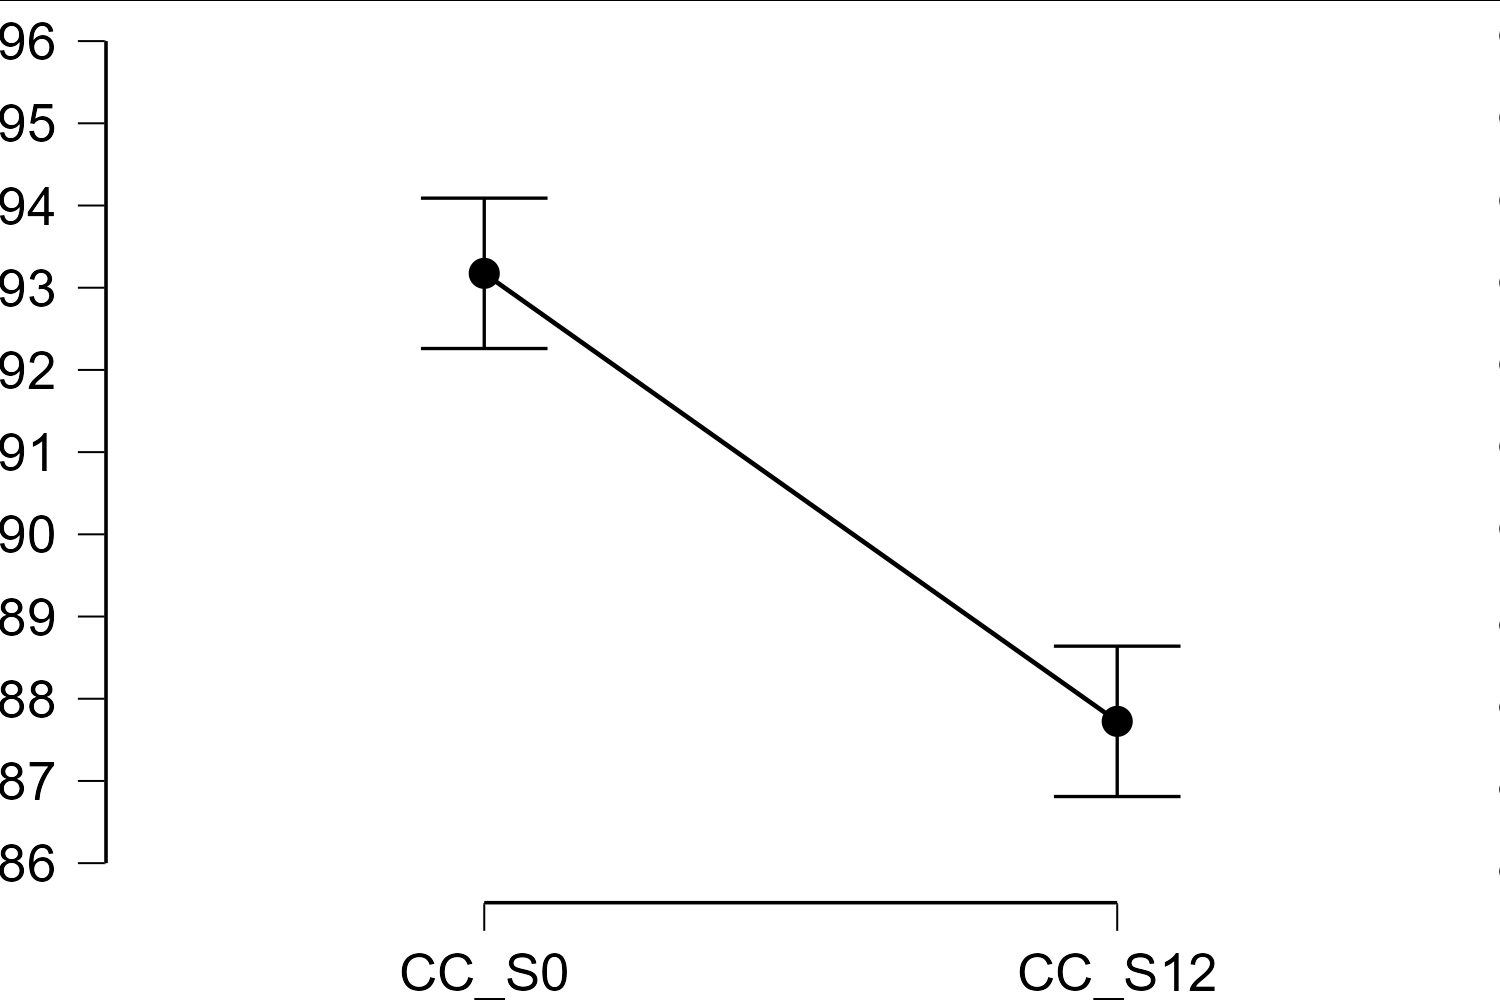
Hello. I was using JASP v 0.16.2 to perform a paired samples t-test. When I checked the "Descriptives plots" box, the corresponding graph showed 95% confidence intervals that seem incorrect (picture attached).
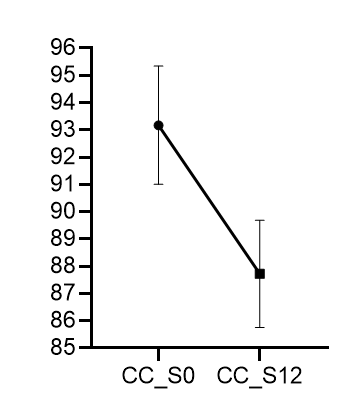
I did the calculations and a graph in a different software (pictures attached), and the results are different from what JASP reports.
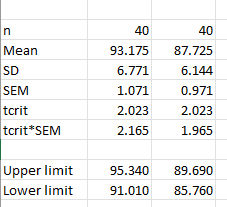
Where SD: standard deviation; SEM: standard error of the mean; tcrit: t critical value for a two-tailed analysis alpha = 0.05 and 39 degrees of freedom.
Am I missing something, or what's the method JASP uses to calculate the 95%CI for that kind of plot?
Thank you.
Comments
It seems the same occurs with the repeated-measures ANOVA descriptive plot.
Hi @AlejandroG ,
The paired samples t-test uses the standard deviation of the differences to draw the CI's, so the descriptives per condition are not telling the full picture here. Similarly, the RM ANOVA also looks at the sd of the condition differences, and then also applies a correction procedure to get more accurate estimates (see the RM ANOVA helpfile for more information and references).
If you want, you can send me the jasp-file or data file and I can take a closer look/give a more thorough explanation of the above.
Kind regards,
Johnny
Hi @JohnnyB ,
Thanks for your answer. I understand that the paired samples t-test analyzes the differences, but the problem is that the descriptive graph depicts something weird with the CI's. I did the math, and the graph is not reflecting the 95%CI's using the SD (and thus the SEM) for the differences, nor the 95%CI's per condition. For instance, the mean for the first condition is 93.175; in the JASP generated graph the upper limit is around 94.1 (i.e., about 1 unit away), but the calculations by hand suggest 2.165 units away. Using the SEM for the differences (i.e., 0.639) will lead to 1.293 units above the mean (0.639 * 2.023 = 1.293). Leading to a 95%CI's of 91.882 to 94.468 for the first sample and 86.432 to 89.019 for the second sample, which does not seem to fit with what's depicted in the graph.
I'm attaching the csv file; it's fictional data used for teaching purposes, so there are no concerns about being publicly available.
Thanks again for your time. Best wishes.
Alejandro.
Hi @AlejandroG ,
Thank you for taking the time to explain your issue. I just looked into the t-test plotting code a bit more, and, just as in the RM ANOVA, we apply the procedure for confidence intervals of group means described in Morey, 2008 (who adopted it from Cousineau) - it is a two-fold procedure:
The normalizing step involves subtracting the individual means, and adding the grand mean, in order to eliminate the participant source of error, which is not of interest here (this leads to the same SEM as you give above, 0.639). However, this induces a biased estimate of the error variance, since it induces a positive covariance between the scores. This bias can be corrected by multiplying the variance by M / (M-1), where M is the number of factor levels. When you apply this correction, you obtain the CI's in the JASP graph (and when you multiply your SEM estimate by sqrt(2), you get the same). Below is some R-code that illustrates these steps:
dat <- read.csv("~/Downloads/Data.csv")
c1 <- dat$CC_S0
c2 <- dat$CC_S12

c1_norm <- c1 - rowMeans(cbind(c1, c2)) + mean(cbind(c1, c2))
c2_norm <- c2 - rowMeans(cbind(c1, c2)) + mean(cbind(c1, c2))
sd(c1_norm) # 2.022153
sd(c2_norm) # 2.022153

cor(c1, c2) # 0.8081113
cor(c1_norm, c2_norm) # -1

corFactor <- sqrt(2 / 1) # M / M-1
ci_diff <- sd(c1_norm) / sqrt(length(c1)) * qt(0.95 / 2 + .5, length(c1) - 1)
mean(c1) + c(-1, 1) * (ci_diff * corFactor) # 92.26041 94.08959
mean(c2) + c(-1, 1) * (ci_diff * corFactor) # 86.81041 88.63959
I hope this clarifies the issue for you. I think we should add a footnote to the graph to clarify.
Kind regards,
Johnny
This is a fine approach. (I've been forced--by a journal editor--to use it in the past). However, I think the result can also be misleading. The interval is drawn around a particular mean, suggesting that it pertains to confidence about the location of a population mean, Yet, the computed interval pertains to the location not of a mean but of a difference between population means. Ideally, the user would have the option to turn off the Morey-Cousineau feature.
R
Hi @JohnnyB ,
Thanks a lot for the explanation. Now all makes sense.
Best wishes,
Alejandro.