Path plot in PCA

Hi everyone,
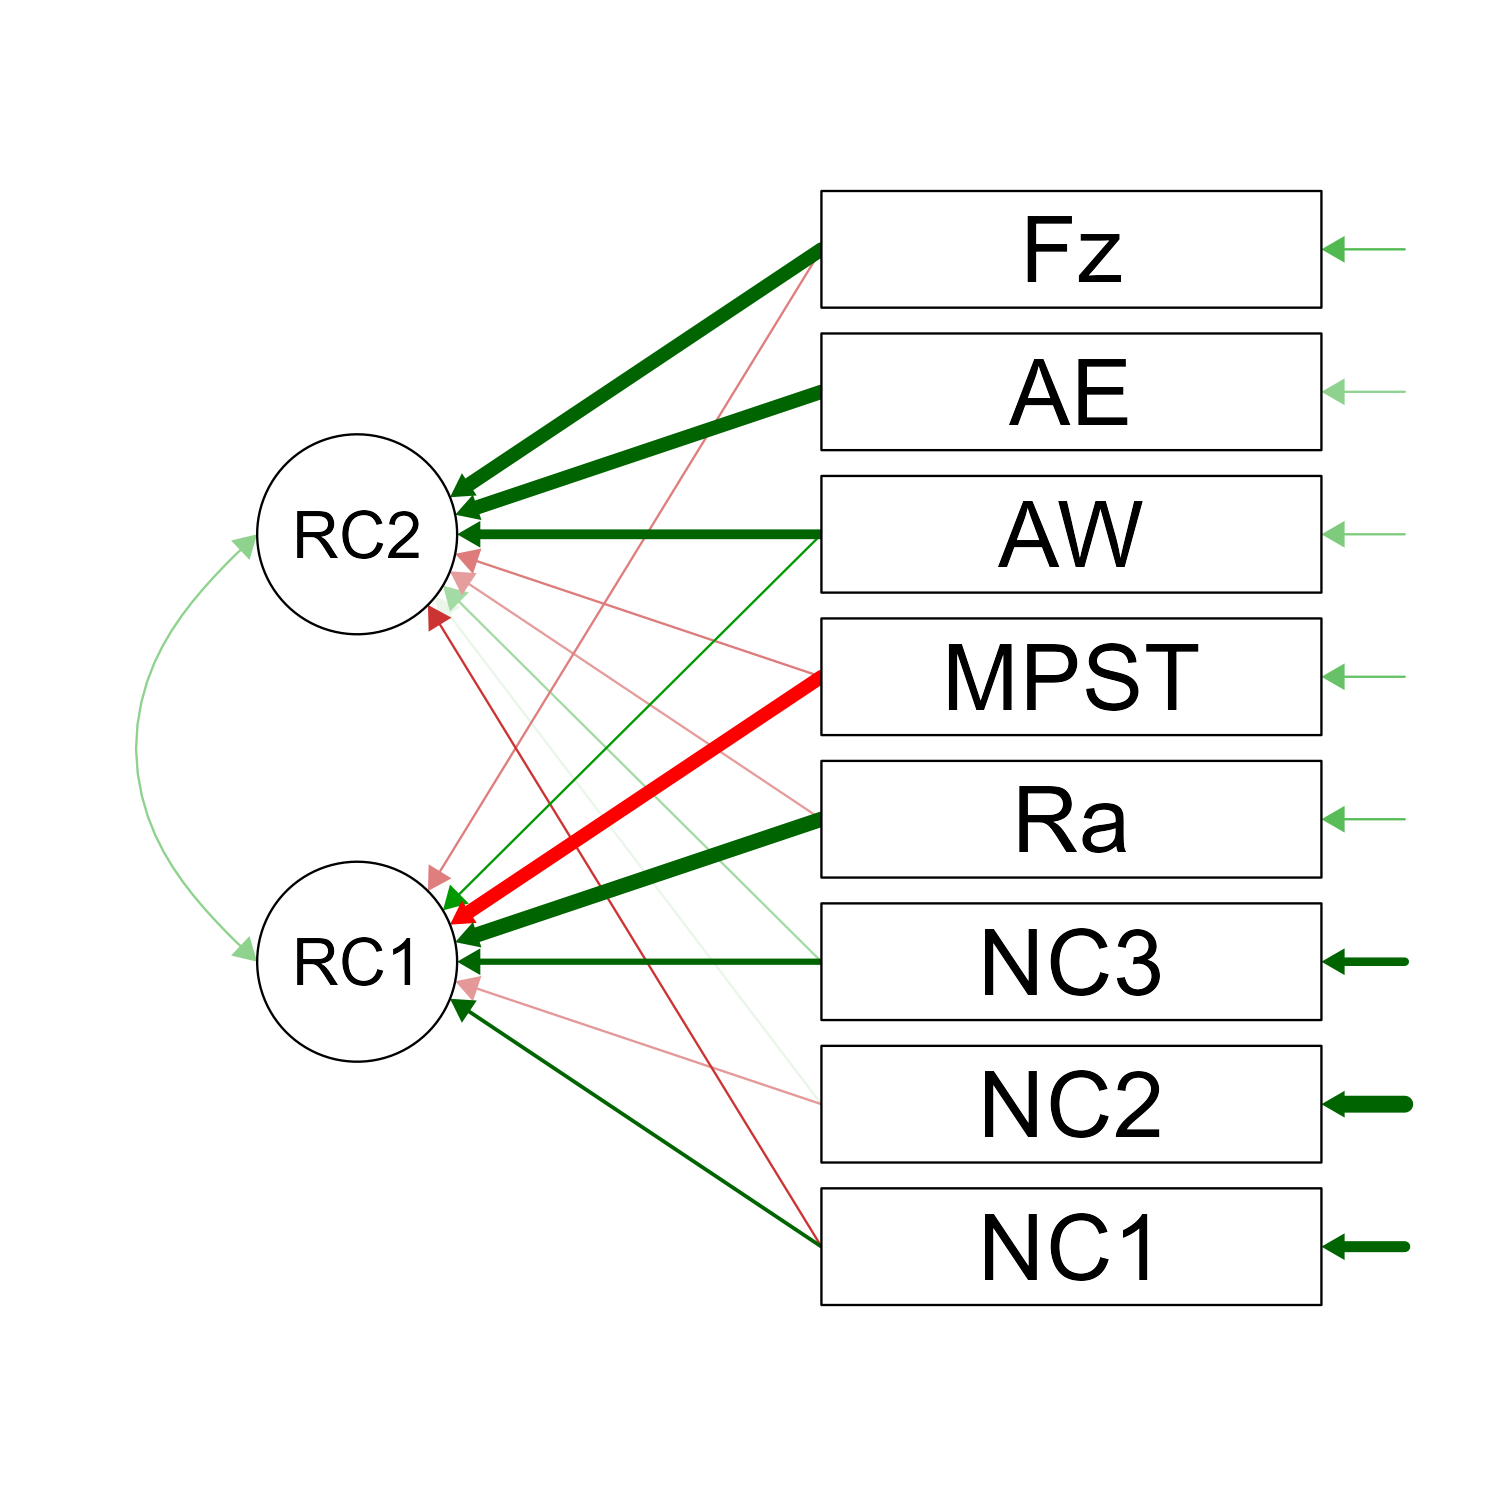
What is the meaning of the short green arrows at the right of the path plot?

It looks like you're new here. If you want to get involved, click one of these buttons!

Hi everyone,
What is the meaning of the short green arrows at the right of the path plot?
Comments
Hi @Adhamragab,
The arrows on the right represent the residual/error variance. The thicker the arrow, the more variance of the variable is left unexplained by the latent factors.
Cheers,
Simon
I am certain this is explained in the background documentation (e.g., the papers of Sacha Epskamp on this topic, hopefully referred to at the end of the help file). OK, a quick search leads to http://sachaepskamp.com/semPlot where there is a link to a paper (http://sachaepskamp.com/files/semPlot_paper.pdf). In the paper, there is this fragment:
"The argument style = "lisrel" specifies that (residual) variances are plotted similar to the way LISREL plots these: as arrows without origin on endogenous variables only. The default, style = "ram", would plot these residuals as described by Boker, McArdle, and Neale (2002): as double-headed self-loops on both endogenous and exogenous variables."
Ergo: residual variances.
E.J.
Thanks Simon
Thanks E.J.
This solved my problem.