

Sequential analysis question

Hello,
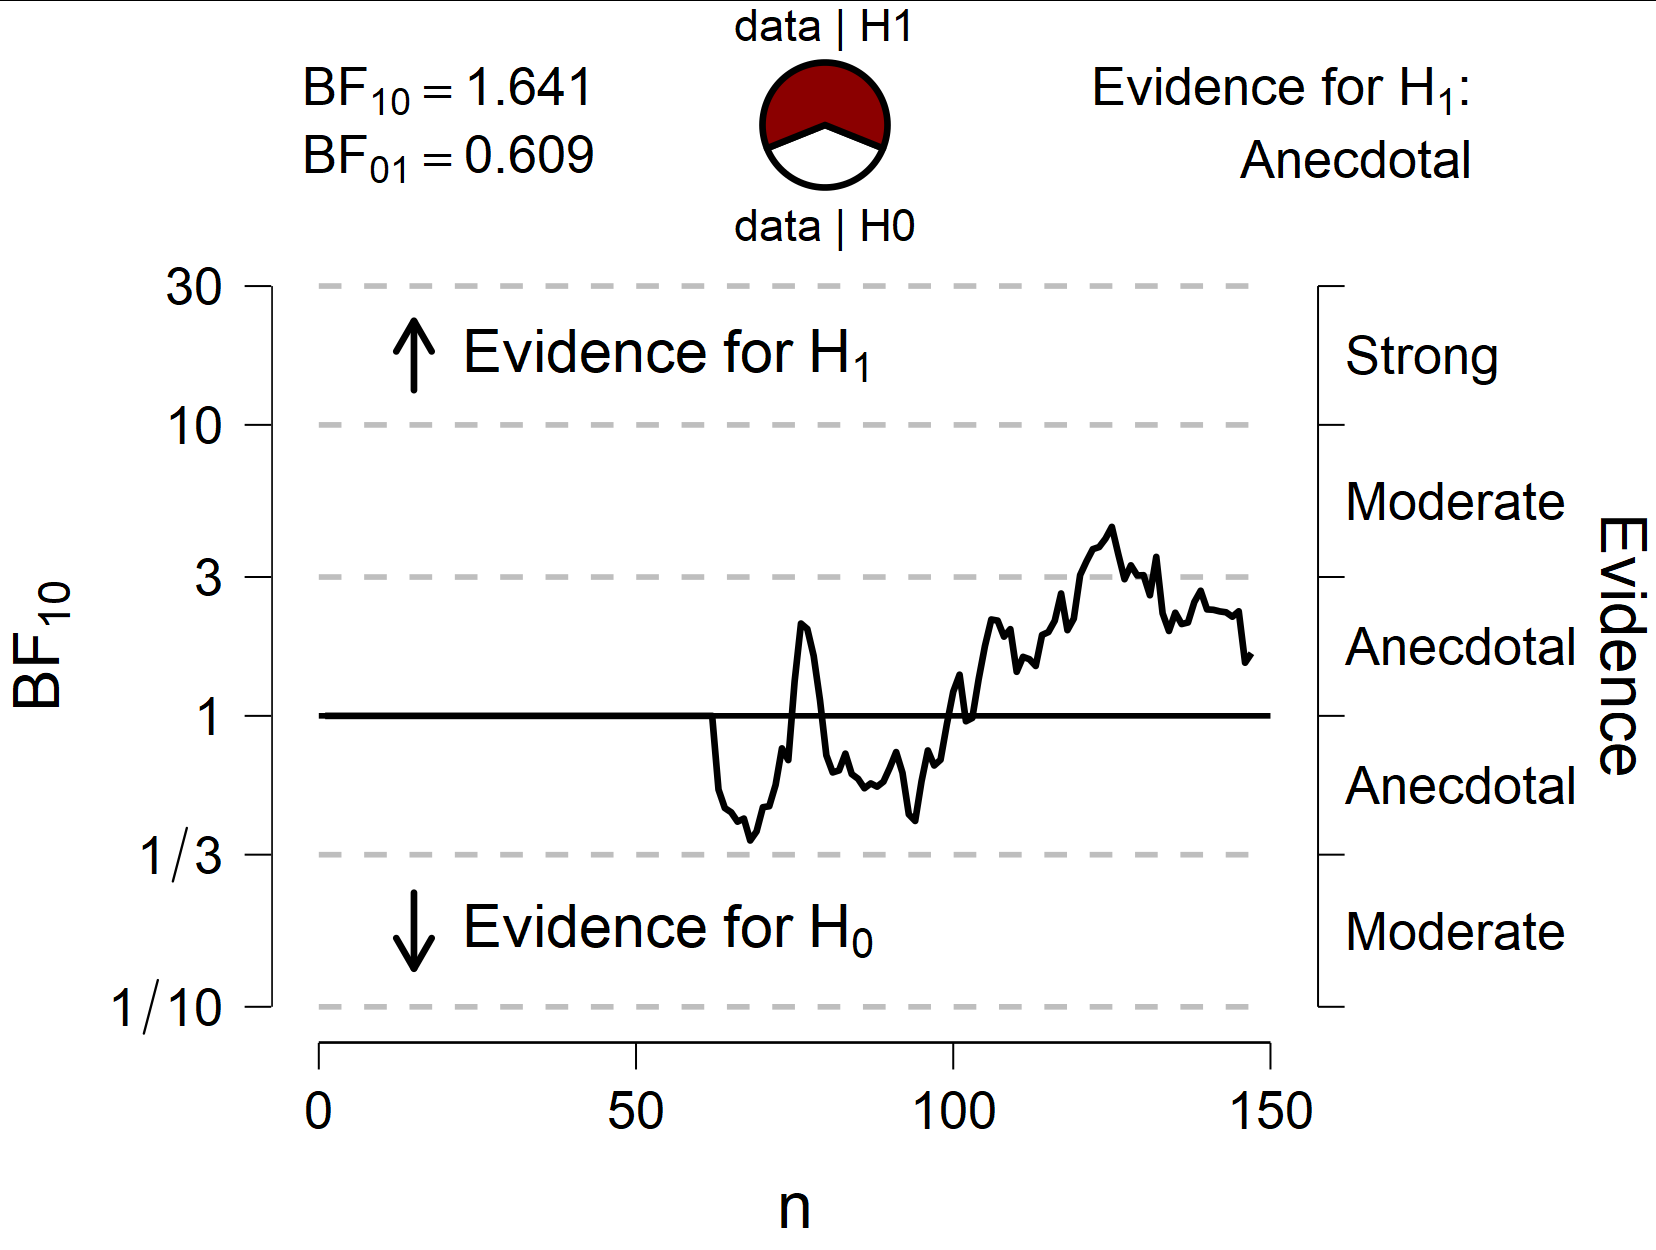
I performed a Bayesian independent samples t-test and also looked at my sequential plot to see how the BF changes with accumulating data. However, till about n = 60, the line remains exactly at BF = 1 (please see below).. Does this make sense?... Would you collect more data when seeing this?
Thank you,
Nathalie
Comments
Yes this makes sense, because all of your first 60 observations probably belong to a single condition. The sequential analysis goes by row order. When all you have seen are data from the one condition, the BF should be 1; only when data from the other condition start to become available will the evidence start to change.
E.J.
Thank you EJ! Yes, this makes sense!
Would you keep collecting data in this case?...
That depends on your resources and the importance of the test. Also, you could do a Bayesian power analysis at this stage and assess the probability of finding could evidence if you continue for the next N trials (e.g., https://psyarxiv.com/9sazk/).
Also, I would consider a directional test, because your hypothesis probably has direction
EJ
Thanks EJ!
I tried to program something in r that uses the method described in the paper. In short:
1 - I computed the mean and SD (assuming my data is normally distributed) for each condition, based on the available data.
2 - Simulated new data for each condition, with the available mean and SD
3 - Combined the new and simulated data
4 - Computed the Bayes Factor
I guess I do something wrong... Lets say I add 20 additional participants (10 per condition), I get rather different BFs each time (from 0.25 to 304). If I repeat it 100 or 1000 times, I get a rather stable BF estimate (around 6)...
Hope you can help!
Nathalie
Hi Nathalie,
Technically, the simulated data ought to be generated from the fitted model. Also note that you can simulate from H0, from H1 (using the information already obtained) or both (using model averaging).
Cheers,
E.J.