

Interpreting interaction effects in Bayesian mixed ANOVA (JASP)

Hello!
I’m looking for help interpreting evidence for a one-way interaction effect from a mixed Bayesian ANOVA (JASP 0.95). I used the Bayesian repeated-measures option with Group as a between-subjects factor and Condition as a within-subjects factor.
I previously ran a frequentist mixed ANOVA on these data, where I have found a significant main effect of Condition and no significant main effect of Group, but a significant Group x Condition interaction. With the Bayesian ANOVA, I’m interested in evaluating evidence for the null hypothesis (BF01) for the Group and Condition main effects to pair with the frequentist results. However, I’m not sure how to interpret or report the evidence for the Group × Condition interaction.
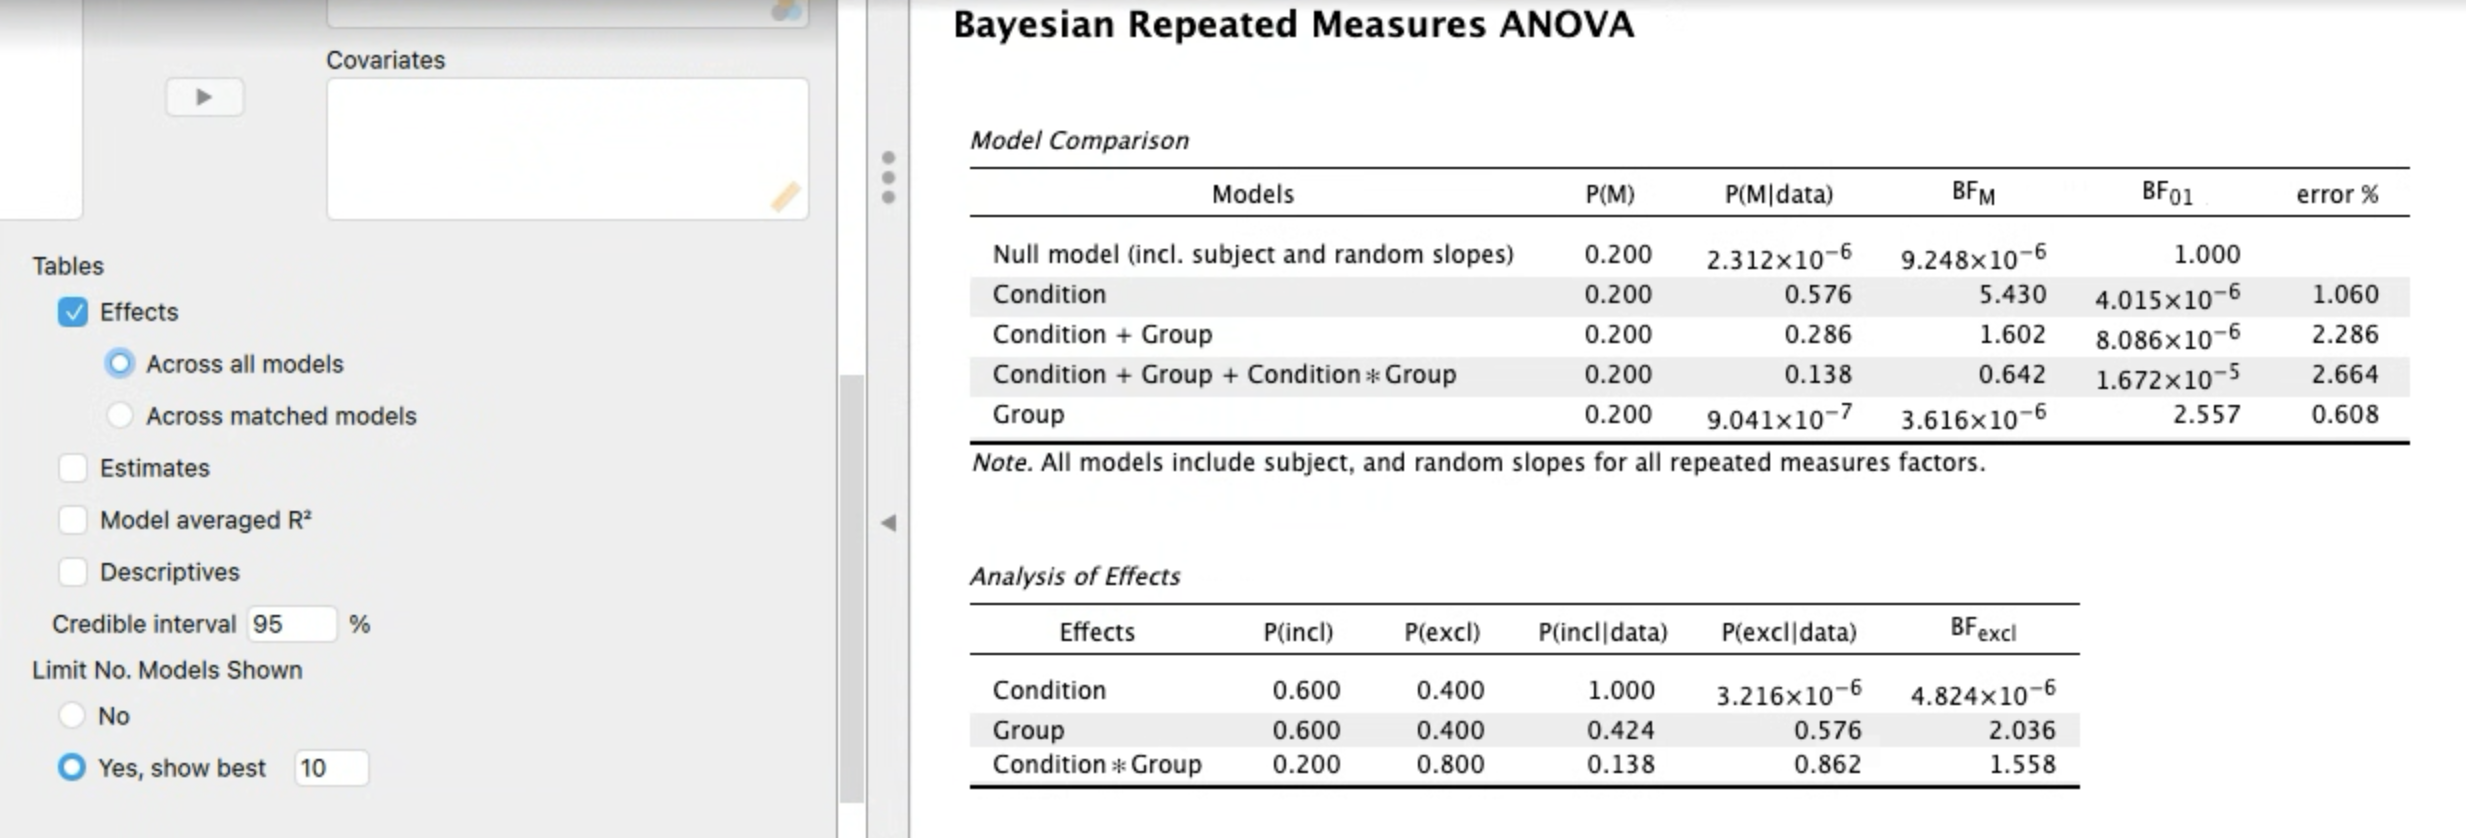
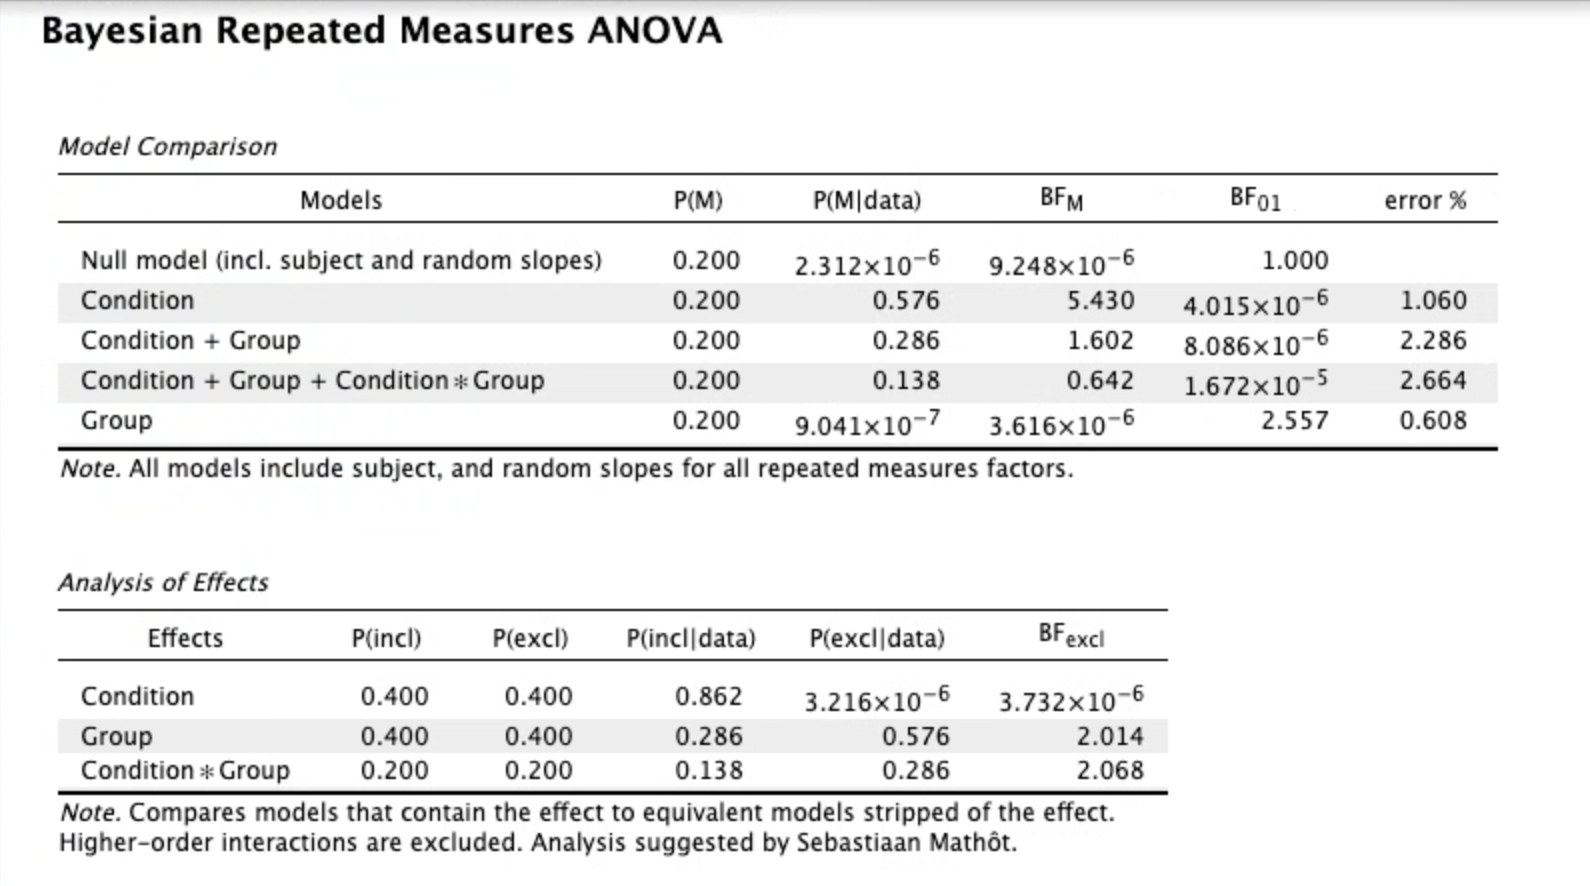
Screenshots below show outputs for this Bayesian mixed ANOVA - one showing effects across all models, the other showing effects across matched models.
Any guidance would be appreciated! I am new to Bayesian stats.
Comments
I think the easier way to do it is to select BF 10 rather than BF 01. I believe you'll get something close to 0.484 for BF INCL, for the Condition * Group interaction in the 'Analysis of Effects' table.
Here is the way *I* would verbally express the interaction result:
"The likelihood of the data given the alternative hypothesis is 0.484 times the likelihood of the data given the null hypothesis. Furthermore, since 0.48 is less than 3.0 there is not substantial evidence favoring the alternative hypothesis. Likewise, since 0.48 is greater than 0.33 there is not substantial evidence favoring the null hypothesis."
Selecting BF 01 instead of BF 10 leads to the same conclusions, but expressed a little differently:
"The likelihood of the data given the null hypothesis is 2.068 times the likelihood of the data given the alternative hypothesis. Furthermore, since 2.07 is less than 3.0 there is not substantial evidence favoring the null hypothesis. Likewise, since 2.07 is greater than 0.33 there is not substantial evidence favoring the alternative hypothesis."
(Note that 1/2.068 is approximately equal to .484, and 1/.484 is approximately equal to 2.068.)
R
Also, you want to select "best model on top" instead of "null model on top" so that the results are a little easier to interpret. And in general I would say the results concerning the interaction suggest "absence of evidence".
I appreciate the quick replies/help! As a small note to the original post, the frequentist ANOVA actually shows no significant interaction effect ("significant" was a typo on my end).
Would you mind explaining why selecting "best model" for the ordering would be more interpretable in this case? Below is the output with this setting (after also switching to view BF10).
A reviewer suggested that adding a Bayesian ANOVA could be helpful to show that there isn’t substantial evidence favoring the alternative hypothesis, which would complement the frequentist stats showing no Group and no Group × Condition interaction effects. My understanding is that comparing each effect against the null model using BF10 answers the question "How much more likely are the data under a model with this effect compared to the null?" and that seems like the most straightforward way to demonstrate weak or absent evidence for an effect (rather than comparing to the best model), especially in parallel with the frequentist results. Please let me know if I’m misunderstanding anything, though!
Though I wouldn't consider myself an expert, my opinion is that Bayesian statistical analysis requires lots of simplifying assumptions and approximations to make the analysis really Bayes' theorem. As a result, the more complex an analysis gets (i.e., the further it is from a t test), the less agreement there is on exactly how the analysis should be done.
R
So when you select "best model on top" it also helps to select BF01 (or BF10 -- the opposite from what you have now). Then, if you look at the BF10 column, you will see that the best model only has "condition", and the data are about two times less likely under the model that also includes Group, and about four times less likely under the full model.
[The more complicated the model, the more researchers are reliant on default prior distributions; this can be a problem if you do have strong background knowledge and you want to use it]