

Why don't BFs align with p values?

Having performed both frequentist and Bayesian versions of a 2x2x2 repeated measures ANOVA on the same dataset, the p values do not align with the BFs in that:
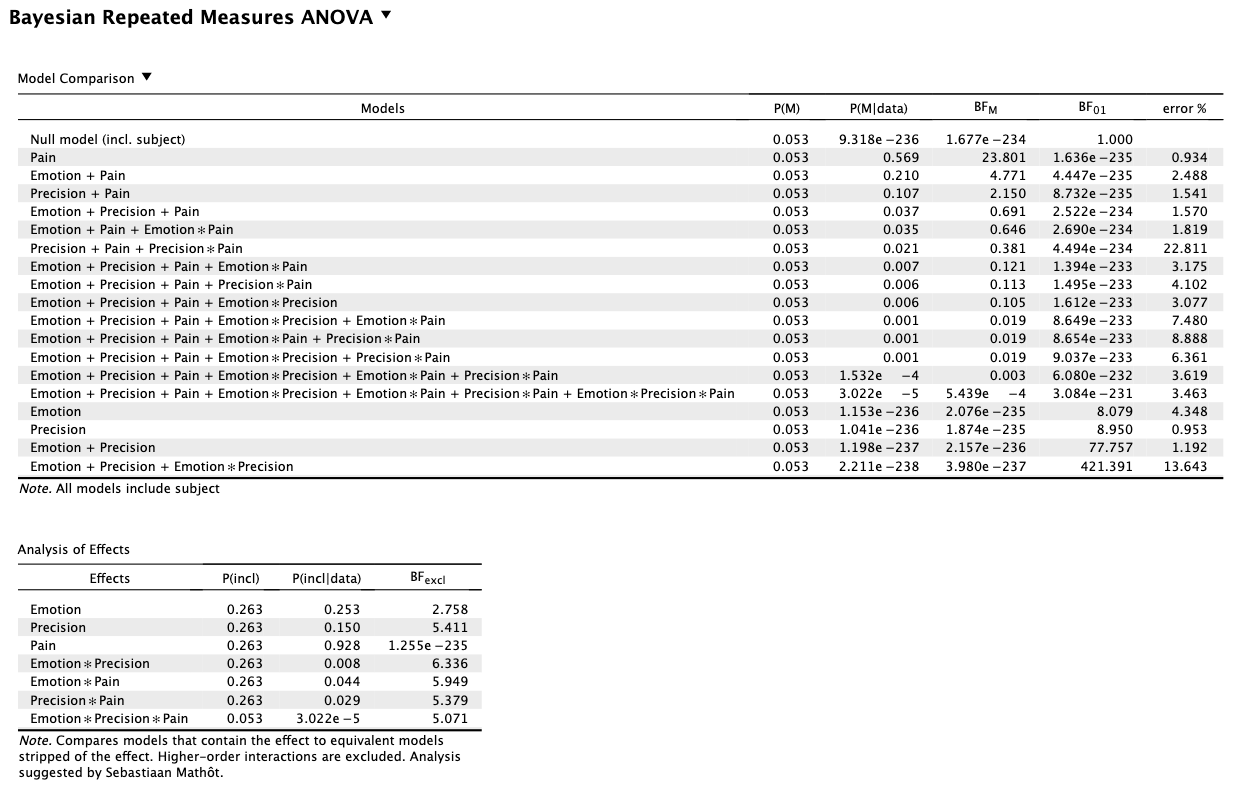
- The frequentist ANOVA provides evidence of a main effect of Emotion (p = .008), while the BFexcl of 2.76 (albeit weakly) provides more evidence against that main effect.
- For the two-way interactions below, the smaller p value ((c) compared to (a)) is paired with a greater BFexcl, while (b) has a larger BF than (a) but a slightly smaller p value.
a) Precision x Own-Pain: p = .926, BFexcl = 5.34
b) Precision x Emotion: p = .907, BFexcl = 6.34
c) Emotion x Own-Pain: p = .381, BFexcl = 5.95
Meanwhile, the three-way interaction has the smallest BF of 5.07 but a p of .923.
The BFs I am referring to are taken from analysis of effects across matched models, comparing to the null model. I used JASP default priors. I attach the output below.
Can anyone explain why this is the case?
Apologies if this has already been asked and answered, and thanks a lot in advance for your help!
Comments
Hi l_s,
There is a subtle difference in the model specification of the frequentist RM ANOVA and the Bayesian one. The frequentist ANOVA does estimate random slopes and takes these into account. The Bayesian ANOVA does not. This is, unfortunately, the default behavior of the BayesFactor R package, but we aim to resolve this difference in a future version of JASP. This difference between the two model specifications becomes particularly relevant when there are interactions among the repeated measures factors. From the screenshot, it looks like you have many interactions, so that is probably the reason why the two analyses differ so much.
See also the discussion here: https://forum.cogsci.nl/discussion/4855/strange-behavior-with-bayesian-rm-anova
Hope this helps!
Cheers,
Don
Hi Don,
Thank you so much for taking the time to reply and explain what is going on here - it's really appreciated!
Thanks!